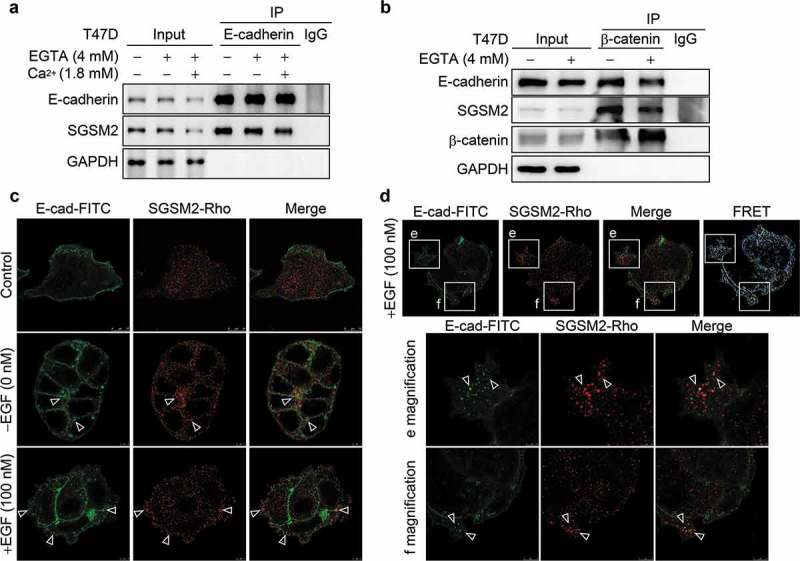
Figure 6.

Interaction between SGSM2 and E-cadherin was verified by co-immunoprecipitation and immunofluorescence staining assays. (a) Co-IP of E-cadherin or (b) β-catenin was assessed via western blotting. T47D cells were treated with or without EGTA (4 mM); calcium ions (Ca2+) (1.8 mM) were further added to reform adherent junctions after treatment with EGTA for 30 minutes. Protein complexes were pulled down by anti-E-cadherin or anti-β-catenin antibody and subsequently analysed by western blotting. Irrelevant IgG was used as a negative control. (c) The colocalization of E-cadherin-FITC (green) and SGSM2-rhodamine (red) was detected by IF staining. EGF (100 nM) was used to induce E-cadherin endocytosis. Scale bar of control: 10 μm; scale bars of EGF – and EGF+: 5 μm. White arrows indicate colocalization of E-cadherin and SGSM2. (d) The colocalization of E-cadherin-FITC and SGSM2-rhodamine was determined by EGF (100 nM) treatment. FRET activity strongly indicated an interaction between SGSM2 and E-cadherin (upper panels; scale bar: 5 μm). Enlarged images of the boxed areas in e and f are shown in the bottom panels. Scale bar of e magnification: 2.5 μm; scale bars of magnifications: 5 μm.
