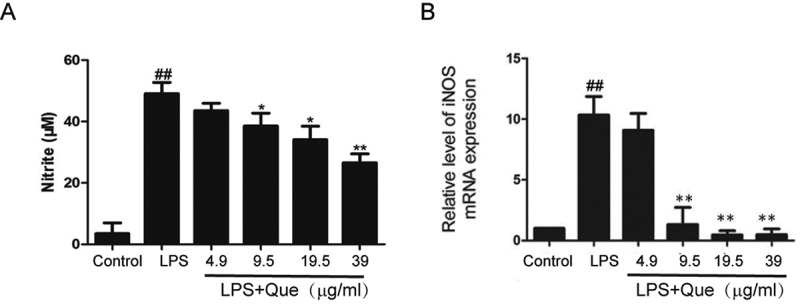
Figure 2.

Influence of quercetin on NO production by LPS-stimulated RAW264.7 macrophages. (a) NO production by Griess Reagent; (b) iNOS expression by qPCR. Data are means of three replicates; experiments were performed in triplicate. ## p < 0.01 compared with the control; ** p < 0.01; * p < 0.05 compared with LPS treatment.
