Figure 4.

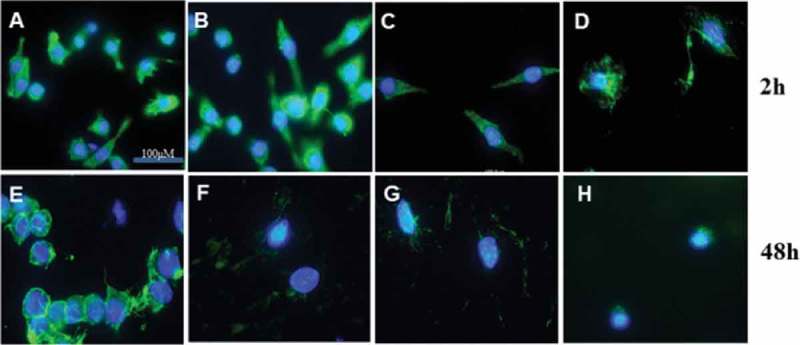
Fluorescence micrographs of the F-actin cytoskeleton of RAW264.7 macrophages after treatment with quercetin for 2 or 48 h. (a) Control; (b) Que 0.4 μg/mL; (c) Que 4 μg/mL; (d) Que 37 μg/mL. Scale bar, 100 μm. Magnification, 100×.

Fluorescence micrographs of the F-actin cytoskeleton of RAW264.7 macrophages after treatment with quercetin for 2 or 48 h. (a) Control; (b) Que 0.4 μg/mL; (c) Que 4 μg/mL; (d) Que 37 μg/mL. Scale bar, 100 μm. Magnification, 100×.