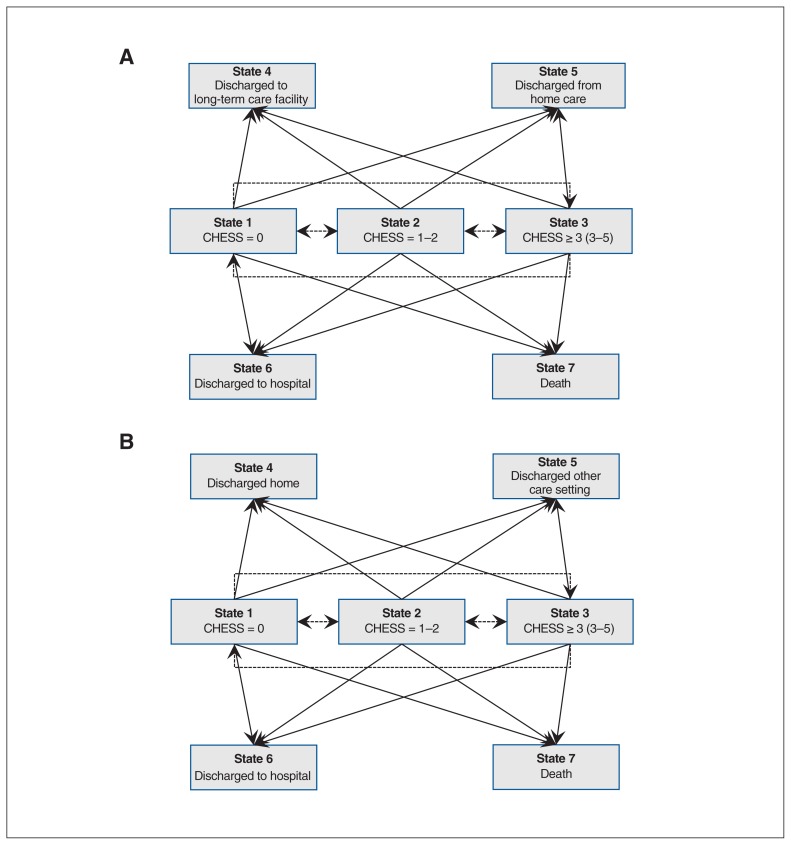
Figure 1:
State-space diagram for possible transitions from home care (A) and long-term (B) care in multistate Markov model. At admission to home care (A) or long-term care (B), clients can be in State 1 (CHESS score = 0), State 2 (CHESS score = 1 or 2) or State 3 (CHESS score ≥ 3), with State 3 representing the greatest health instability and State 1 the least health instability. From this initial state, clients who remain in home care (A) or long-term care (B) can improve (e.g., a transition from State 2 to State 1, or a transition from State 3 to State 1 or 2) or can worsen (e.g., transition from State 1 to State 2 or 3, or transition from State 2 to State 3). A client can also transition out of home care (A) from 1 of the 3 initial admission states (State 1, 2 or 3) to 1 of 4 possible discharge possibilities: discharge to a long-term care facility (State 4), discharge from home care (no longer requiring services, State 5), discharge to hospital (State 6) or death (State 7). A long-term care resident (B) can transition out of long-term care from 1 of the 3 initial admission states (State 1, 2 and 3) to 1 of 4 possible discharge possibilities: discharge home (State 4), discharge to another care setting (State 5), discharge to hospital (State 6) or death (State 7). In Figure 1A the broken lines reflect transitions between health states for those remaining in home care. The solid lines reflect transitions to “absorbing states” outside of the home care. In Figure 1B the broken lines reflect transitions between health states within the long-term care facility. The solid lines reflect transitions to “absorbing states” outside of the long-term care facility.

