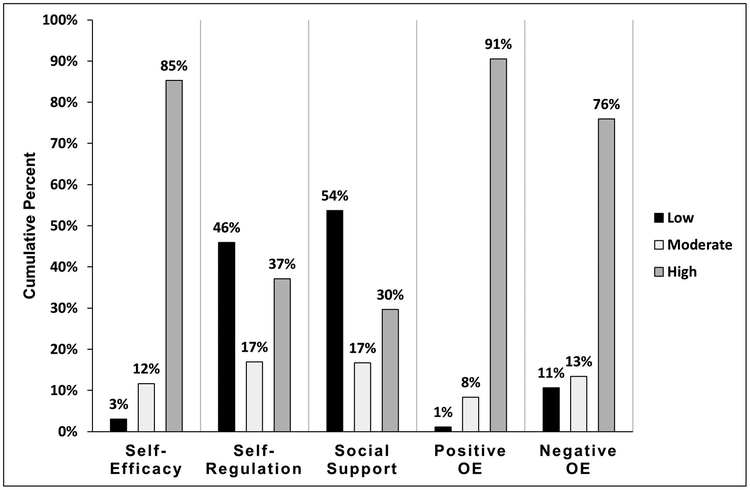
Figure 2.

Percent of questionnaire responses by category (Low, Moderate, High) for each questionnaire. Questionnaire responses were converted into categorical responses reflecting degree of agreement with questionnaire items. For self-efficacy (10-point scale), original responses of 1–3 = Low, 4–6 = Moderate, and 7–10 = High. For the remaining questionnaires (5-point scales), original responses of 1–2 = Low, 3 = Moderate, 4–5 = High. High responses consistently exceeded Low responses for self-efficacy, positive outcomes expectations, and negative outcomes expectations, whereas responses were much more variable for self-regulation and social support. Abbreviation: OE, outcomes expectations.
