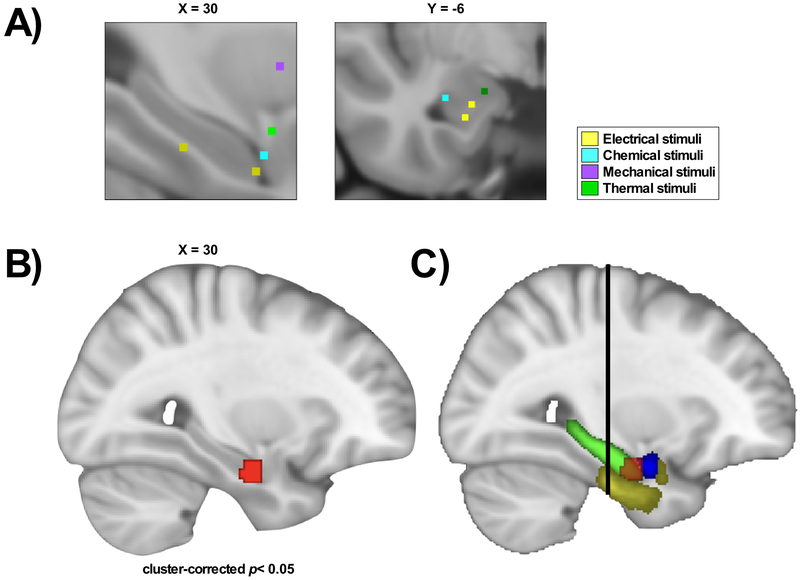
Fig.2. Peak activation in the anterior hippocampus in healthy participants during experimental pain conditions, compared to control conditions.
The ALE meta-analysis of noxious experimental conditions and baseline conditions in healthy participants with MTL activation (n=22 experiments). (A) Close-up of foci activation in the MTL, color-labelled according to stimuli. (B) The map shows one significant cluster (red) in the right anterior hippocampus (antHC), parahippocampal gyrus and amygdala (cluster-corrected p< 0.05, cluster-forming height threshold of p< 0.005 with 1000 permutations). (C) The map shows the delineation of the significant cluster in red and the different regions of the MTL: parahippocampal gyrus (yellow), amygdala (blue) and hippocampus (green). The black line represents MNI Y=−21, which represents the border between the anterior and posterior hippocampus [116].

