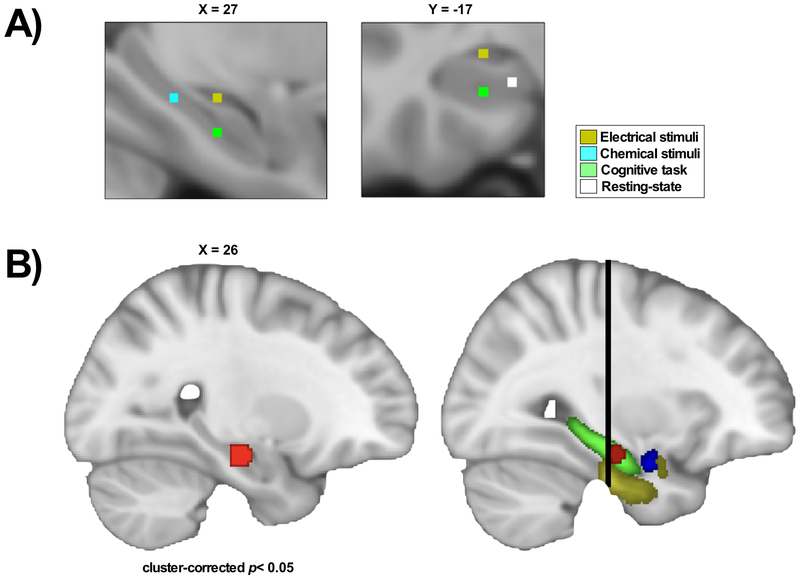
Fig.3. The anterior hippocampus shows significantly less activity in chronic pain, compared to healthy participants.
The ALE meta-analysis compared chronic pain studies versus healthy participants with MTL activation (n=11 experiments). (A) Close-up of foci activation in the MTL, color-labelled according to stimuli. (B) The map represents one significant cluster in the right anterior hippocampus (antHC). Patients with chronic pain had consistently lower activity in this region compared to healthy participants (cluster-corrected p< 0.05 at cluster-forming height threshold of p< 0.005 with 1000 permutations). (C) The map shows the cluster in relation to other MTL structures: the hippocampus (green), the amygdala (blue) and the parahippocampal (yellow). The black line represents MNI Y=−21, which represents the border between the anterior and posterior hippocampus [116].

