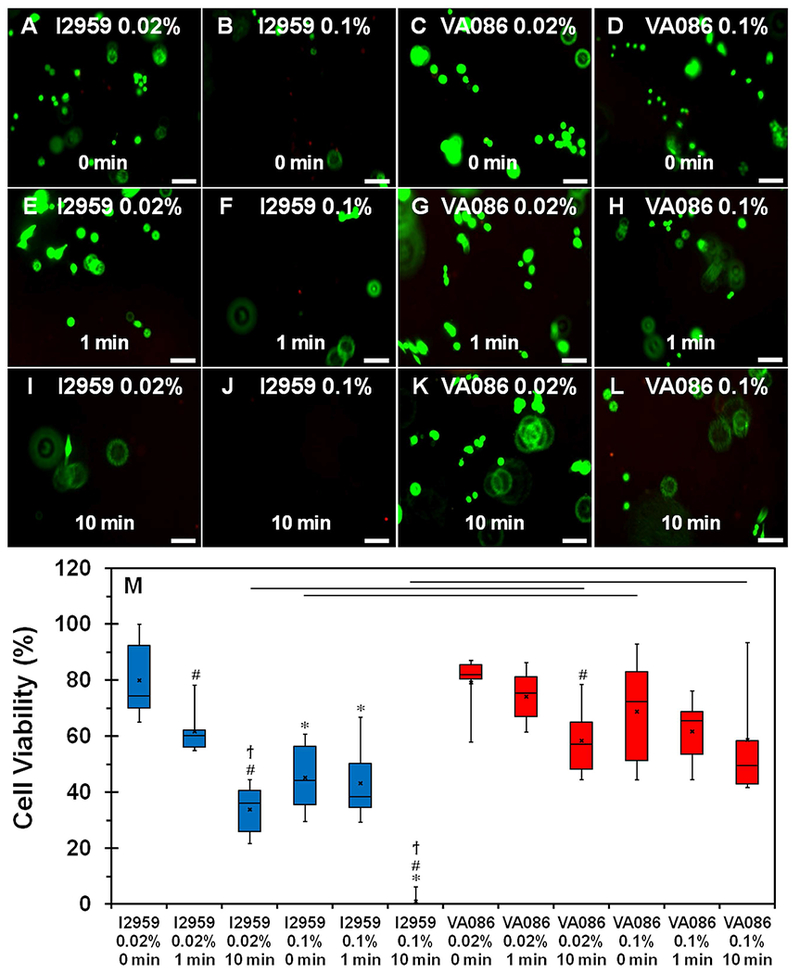
Figure 4:

(A-L) Live-dead assay to assess the viability of Saos-2 cells cultured within photochemically crosslinked CMA hydrogels (live cells stain green and dead cells stain red). (M) Quantification of cell viability plot. The boxes represent 25th to 75th percentile of the data separated by a horizontal line at the median. The whiskers show the upper and lower extremes. “x” mark shows the mean (‘*’ denotes p < 0.05 when comparing different photoinitiator concentration for the same photoinitiator type and crosslinking time, ‘#’ denotes p < 0.05 when comparing 1 min and 10 min crosslinking times with 0 min for the same photoinitiator type and concentration; ‘ϯ’ denotes p < 0.05 when comparing between 1 min and 10 min crosslinking times for the same photoinitiator type and concentration; horizontal line denotes p < 0.05 between photoinitiator type). Scale bar: 100 μm.
