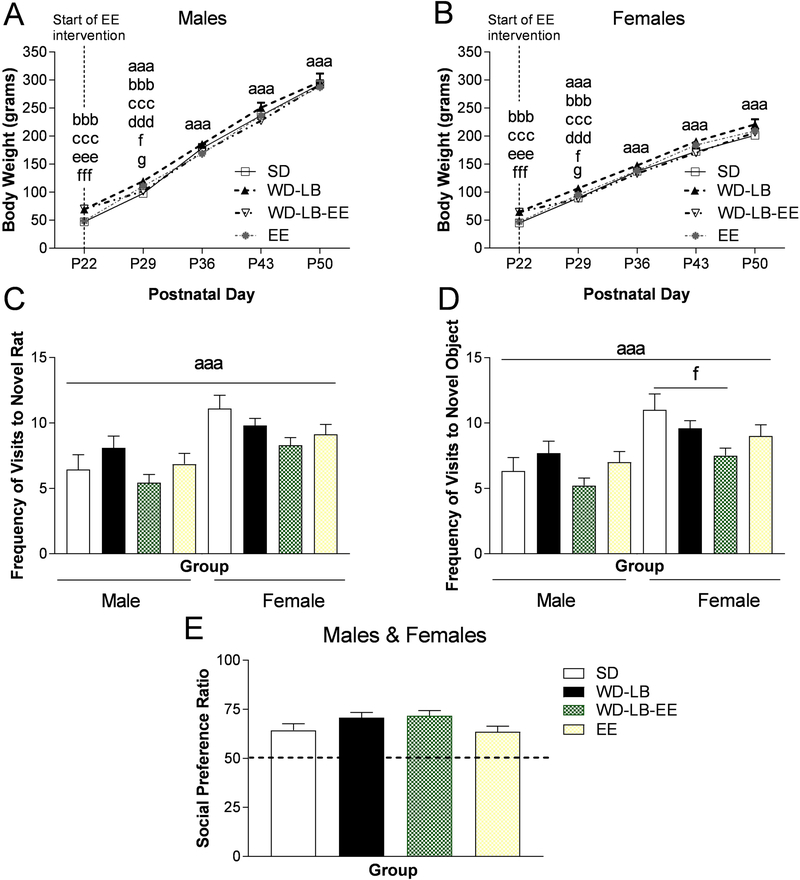
Figure 4.
Offspring body weights (grams) for male (A) and female (B) animals. C) Social preference ratios for male and female (collapsed) offspring. Values >0.05 indicate that the experimental rat spent more time visiting with the novel rat compared to the novel object. The total frequency of visits made to the D) novel rat and E) novel object in the social preference test. All data are expressed as mean ±SEM, n = 8–10. Various symbols are employed (e.g., a, b, c) to delineate differences between groups where ap<0.05, aap<0.01, aaap<0.001 indicates differences between males and females; bindicates differences between SD and WD-LB, cindicates differences between WD-LB and EE, dindicates differences between WD-LB and WD-LB-EE, eindicates differences between WD-LB-EE and EE, findicates differences between SD and WD-LB-EE, and gindicates differences between SD and EE.

