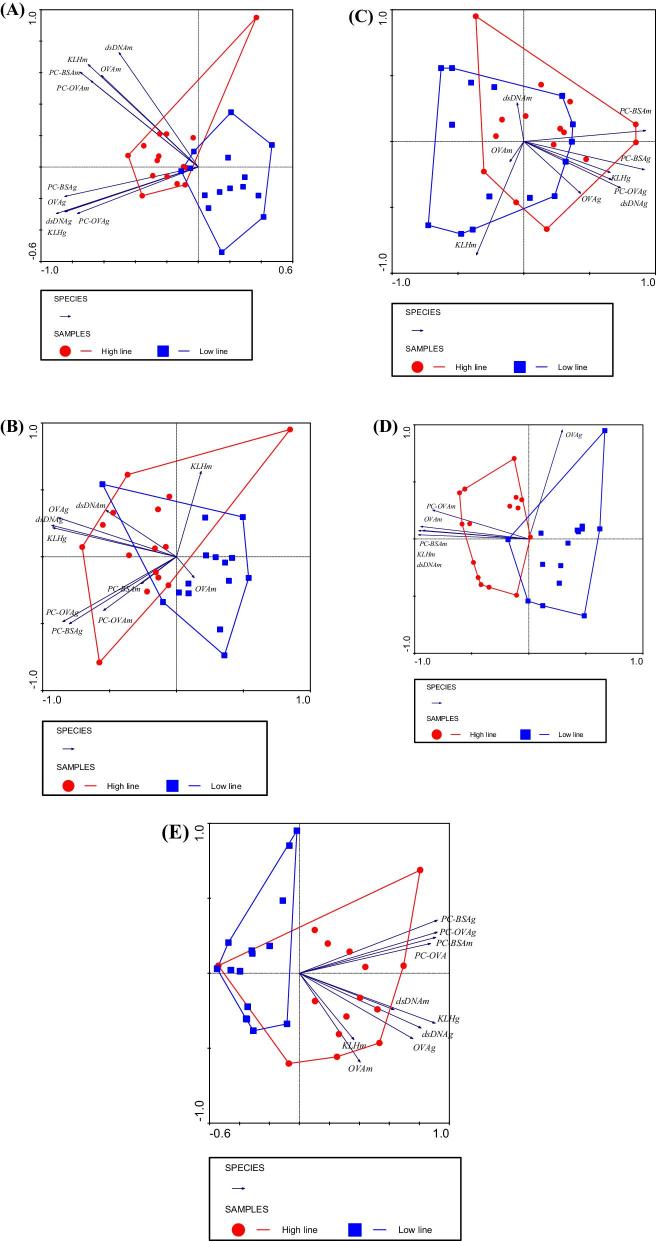
Figure 1.
Grouping by PCA of adult hens (A), hatchlings (B), yolk (C), albumen (D), and day 8 chicks (E) on the basis of IgM and IgG antibody titers to 5 antigens: KLH, PC-BSA, PC-OVA, dsDNA, and OVA. Diagrams include 15 birds or specimens from each line (enveloped) that were analyzed with ELISA. ‘Eigen values’ explaining the amount of variation were 60% horizontal and 20% vertical (A); 64% horizontal and 13% vertical (B); 58% horizontal and 17% vertical (C); 74% horizontal and 19% vertical (D); 73% horizontal and 12% vertical (E). Diagrams include antigen and isotype combinations (arrows). Length and direction of arrows indicate the contribution of the antigen–isotype combination to the grouping of the lines. Small fonts after the antigen label represent the isotype m: IgM and g: IgG.

