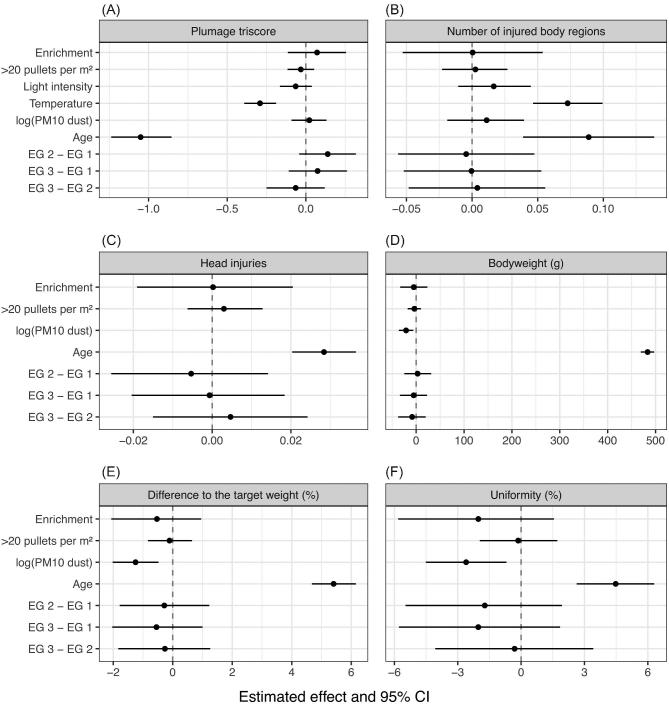
Figure 2.
Estimated effect of predictors on the response variables. Estimated effects (solid circles) and 95% confidence intervals (CI; bars) are shown in the diagram for plumage triscore (A), the number of injured body regions (B), head injuries (C), bodyweight (D), difference to the target weight (E), and uniformity (F). If all values of the CI are either positive or negative, the effect is considered significantly increasing or decreasing, respectively. The wider the CI, the less precise is the estimation. The size of the effect can be seen in the distance of the estimated effect from the zero line. However, the scales of the diagrams are standardized and the actual size of the estimated effect can only be seen in the text for the significant effects. For each estimation n = 90 was used in the statistical analysis. EG = experimental group, PM10 = particulate matter 10 (particles < 10 μm).

