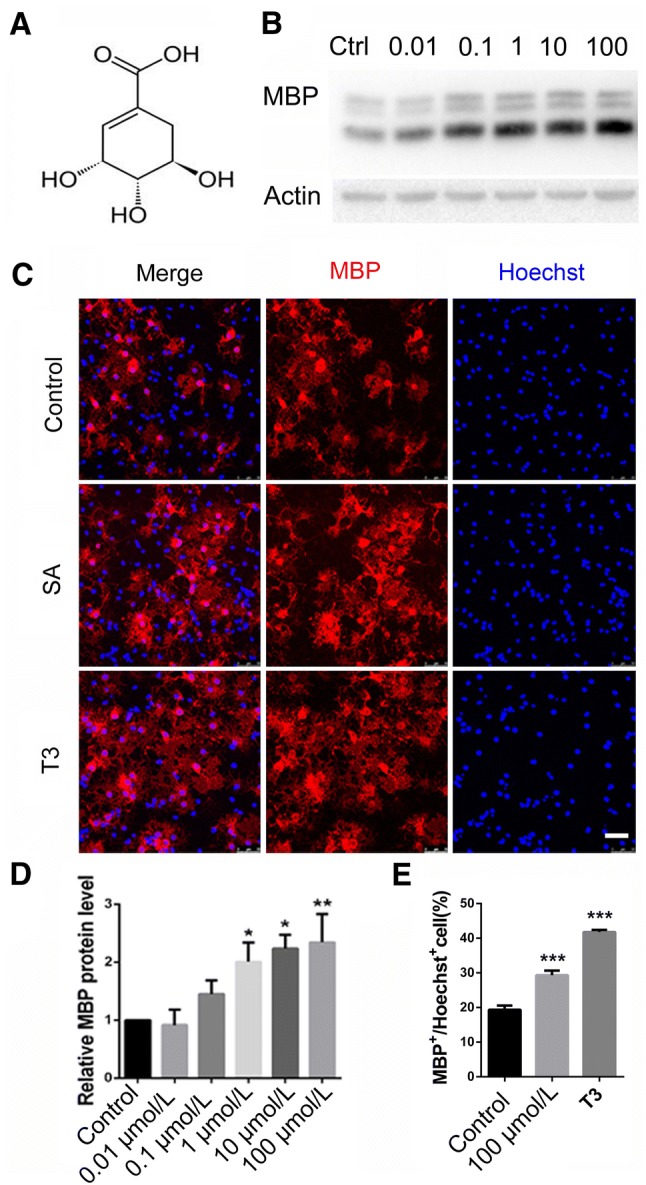
Fig. 1.

SA increased myelin basic protein (MBP) expression in OPCs in vitro. A Structural formula of SA. B Western blots of MBP expression after 0.01 μg/mL, 0.1 μg/mL, 1 μg/mL, 10 μg/mL, and 100 μg/mL SA treatment in cultured primary OPCs. C Representative images of immunofluorescence staining for MBP (red) in vehicle, SA (100 μg/mL), and T3 groups. D Quantification of the relative expression levels of MBP protein as in B. E Numbers of MBP-positive cells as in C. Data are shown as mean ± SEM. *P < 0.05, **P < 0.01, ***P < 0.001, one-way ANOVA with Tukey’s post hoc test. Scale bar, 50 μm.
