Fig. 10.
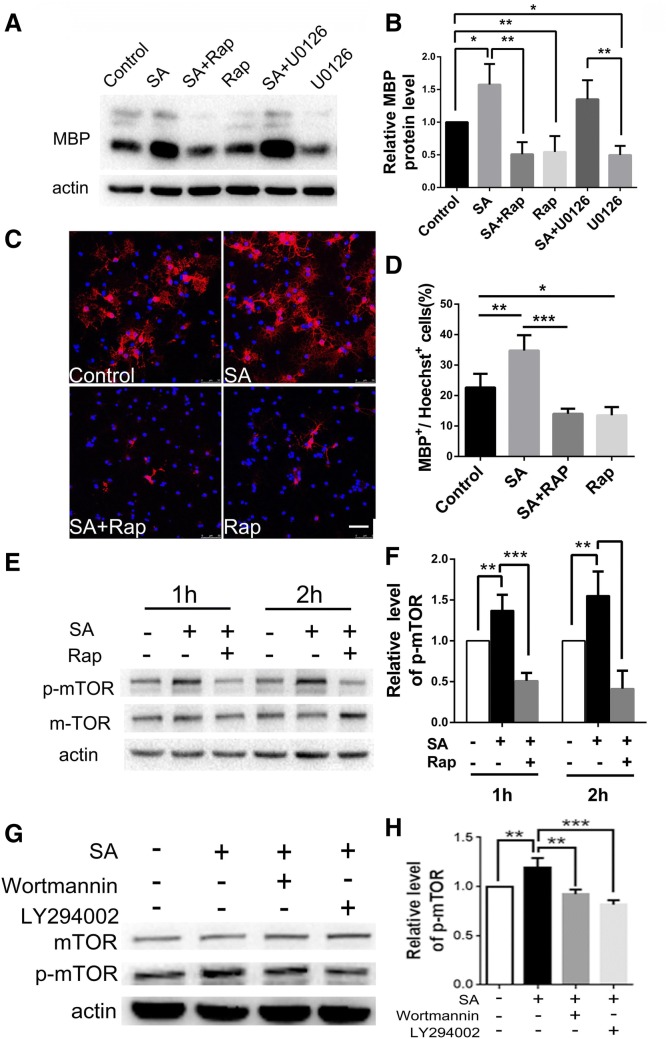
SA promotes OPC differentiation through activating the mTOR pathway. A Western blots showing the MBP expression in OPCs induced by SA plus the mTOR inhibitor rapamycin (Rap) (10 nmol/L) or the Erk1/2 inhibitor U0126 (2 nmol/L) and their control groups. B Relative expression levels of MBP protein as in A. C Representative immunofluorescence images showing MBP-positive cells (red) in the SA plus Rap group versus its controls. D Numbers of MBP-positive cells as in C. E Western blots showing the p-mTOR levels in the SA plus Rap group versus its controls. F Relative p-mTOR levels as in E. G Western blots showing the p-mTOR expression levels in SA plus wortmanin or LY294002 group versus its controls. H Relative p-mTOR levels as in G. Data are shown as mean ± SD. *P < 0.05, **P < 0.01, ***P < 0.001, Student’s t-test. Scale bar, 50 μm.

