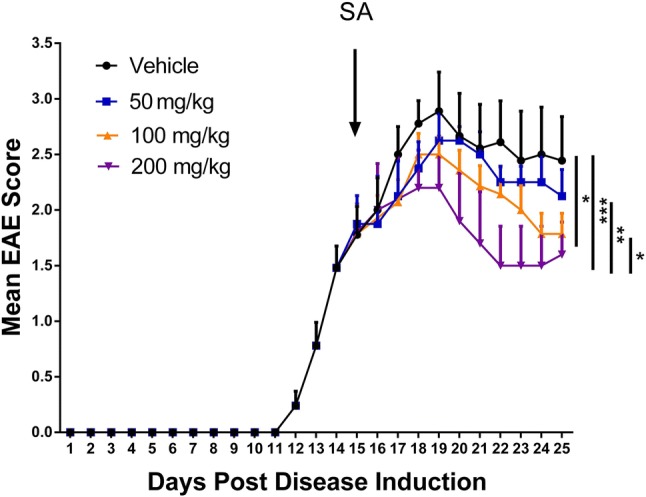
Fig. 4.

SA ameliorates progression of EAE. The graph shows the daily clinical EAE score in the SA (50 mg/kg, 100 mg/kg, and 200 mg/kg) and vehicle groups (once a day from 15 dpi). Analysis showed significant differences among the groups. Data are shown as mean ± SEM, n = 5/group in each experiment; *P < 0.05, **P < 0.01, ***P < 0.001, the nonparametric Mann–Whitney U test was used to compare two groups and the Kruskal–Wallis test with Dunn’s post hoc test to compare four groups.
