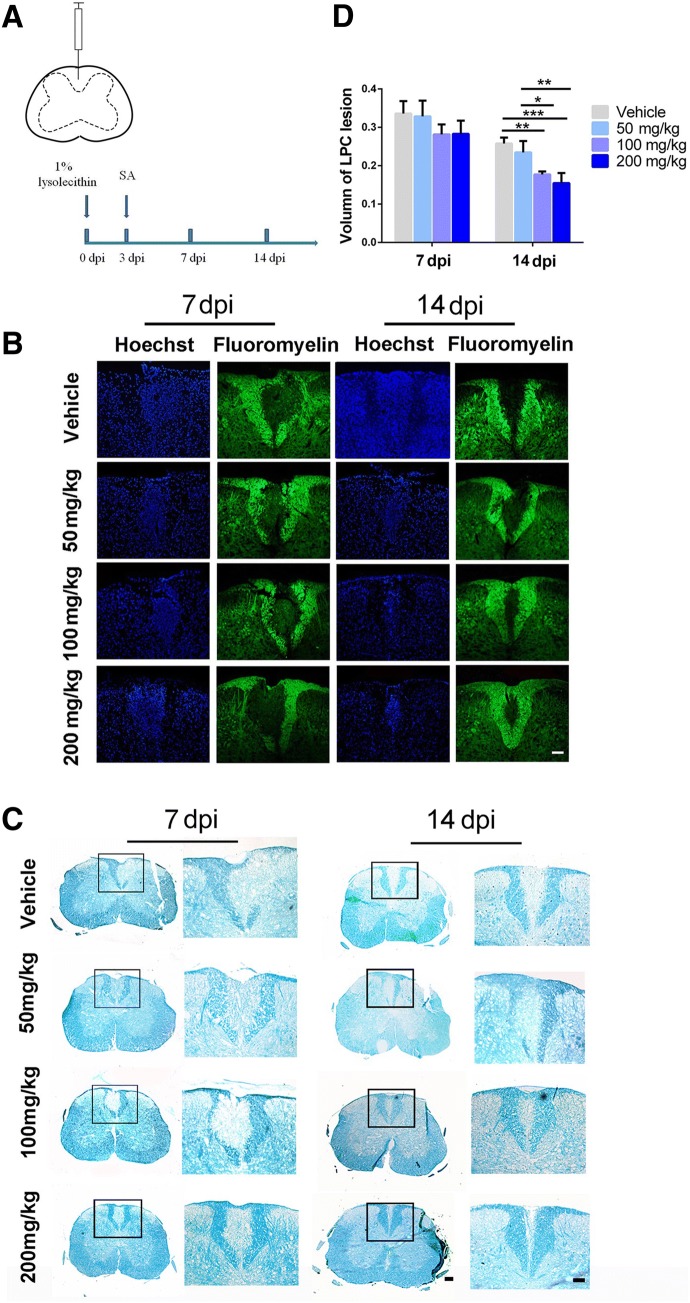
Fig. 7.
SA enhances remyelination in LPC-induced focal demyelination lesions. A Schematic illustrating the injection site and the timing of the LPC model as well as the time SA was administered. B, C Representative images of Fluoromyelin (B) and LFB staining (C) showing the demyelinated region in the dorsal column of the spinal cord. D Quantification of the volume of demyelination as in B and C. Data are shown as the mean ± SEM, n = 5/group in each experiment. *P < 0.05, **P < 0.01, ***P < 0.001, one-way ANOVA with Tukey’s post hoc test. Scale bars, 100 μm.

