
Fig. 8.
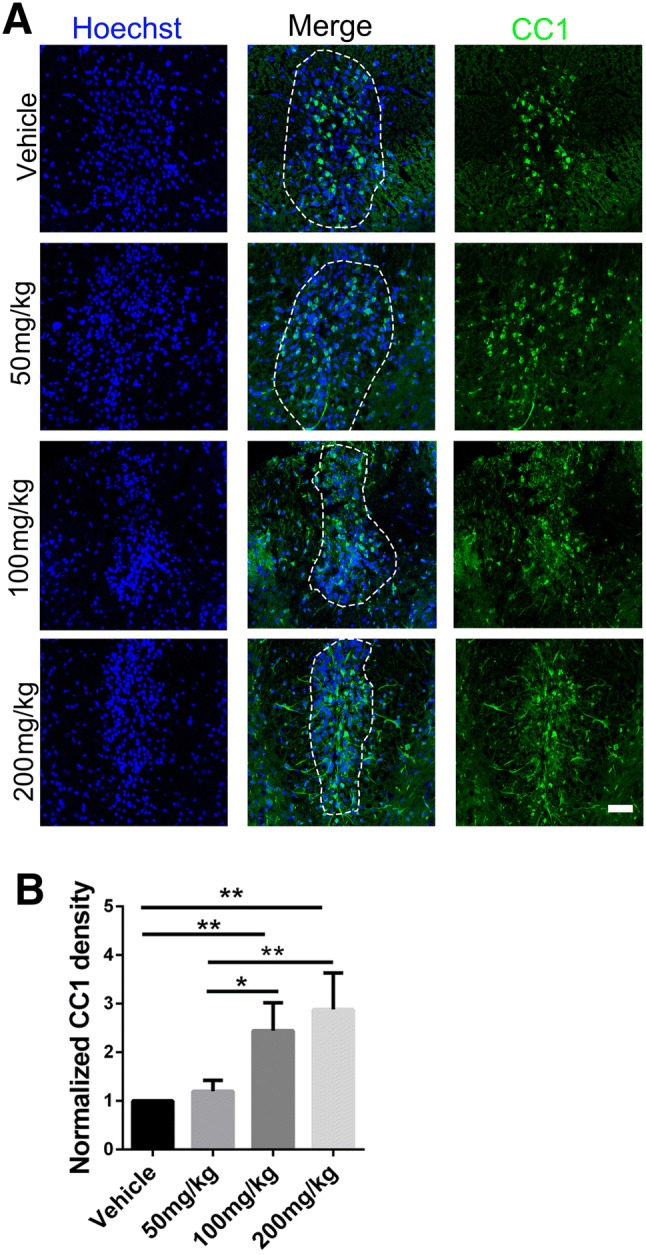
SA increases the number of mature OLs during remyelination in LPC lesions. A Representative immunofluorescence images showing CC1 (green) positive cells within the lesion (approximated by dotted line) at 14 dpi in SA (50 mg/kg, 100 mg/kg, and 200 mg/kg) and vehicle-treated mice. B Ratios of CC1-positive cells per lesion area as in A. Data are shown as mean ± SEM, n = 5/group in each experiment, *P < 0.05, **P < 0.01, one-way ANOVA with Tukey’s post hoc test. Scale bar, 100 µm.