
Fig. 2.
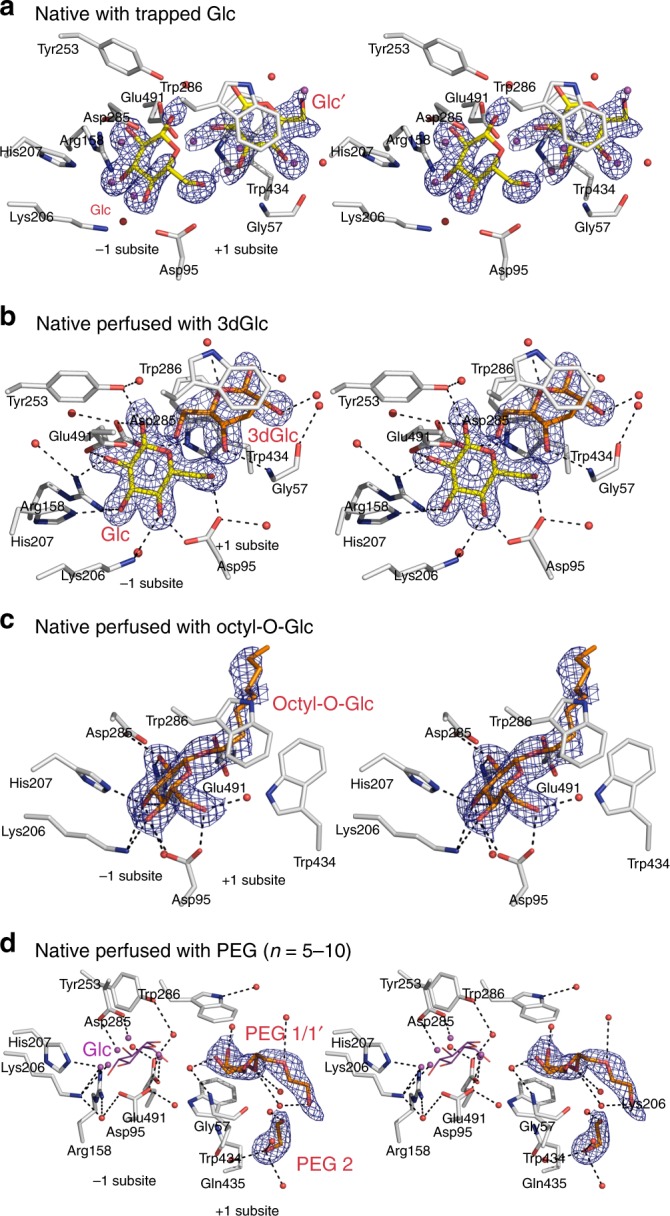
Native HvExoI with trapped Glc, and with perfused 3dGlc, octyl-O-Glc and PEG. a Stereo view of native HvExoI with Glc (Glc and Glc′, carbons: yellow sticks) at 0.5 occupancy, which oscillates between the −1 and +1 subsites. b Stereo view of native HvExoI with Glc (carbons: yellow sticks) and 3dGlc (carbons: orange sticks) at 1.0 occupancies, bound in the −1 and +1 subsites, respectively. c Stereo view of native HvExoI with octyl-O-Glc (carbons: orange sticks) at 1.0 occupancy, bound across the −1 and +1 subsites. d Stereo view of native HvExoI with two PEG (n = 5–10) molecules (carbons: orange sticks; PEG 1 in two alternate conformations at occupancies 0.5 each and PEG 2 at occupancy 1.0), bound in the +1 and putative +2 subsites. Grey, red, and blue represent carbon, oxygen and nitrogen atoms, respectively. Water molecules are shown as red or magenta (bound alternate water molecules when the ligand is missing and are not numbered) spheres in complexes with Glc and PEG. In the PEG complex magenta-coloured water molecules mimic positions of OH groups of Glc (added for illustration in magenta lines). Separations of less than 3.50 Å from active site residues (carbons: grey sticks) are shown as dashed lines. Derived |2mFobs − DFcalc| electron density maps are contoured at 1σ (blue mesh). In |2mFobs − DFcalc|, Fobs and Fcalc are observed and calculated X-ray structure factor amplitudes, where m is the figure of merit and D is the estimated coordinate error