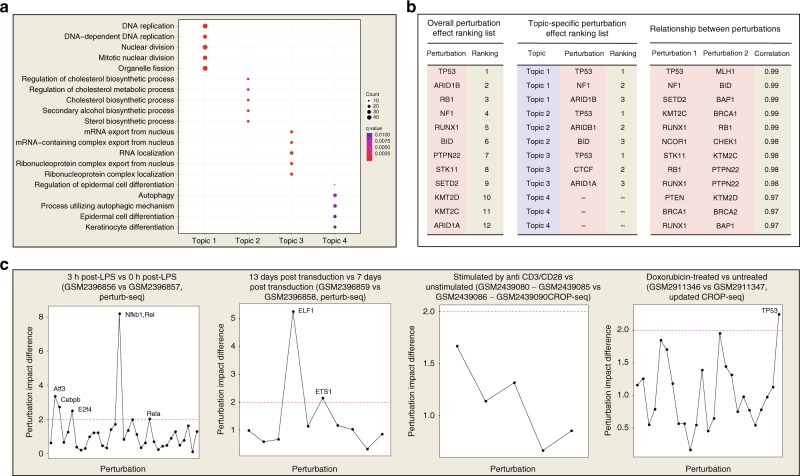
Fig. 3.
An illustration result of MUSIC for single-cell CRISPR screening data analysis. We take the dataset of MCF10A cells treated with doxorubicin (GSM2911346) by the updated version of CROP-seq8 as an example, as illustrated in (a, b). The overall perturbation effect ranking lists identified by MUSIC were also compared between cells with different treatment, as illustrated in (c). a The functional annotations of each topic derived from topic modeling for dataset GSM2911346. b The overall perturbation effect ranking list and the topic-specific perturbation effect ranking list for dataset GSM2911346. c The differences of perturbation impact between different experimental conditions are demonstrated respectively for Perturb-Seq5 and CROP-seq7,8 data

