Fig. 2.
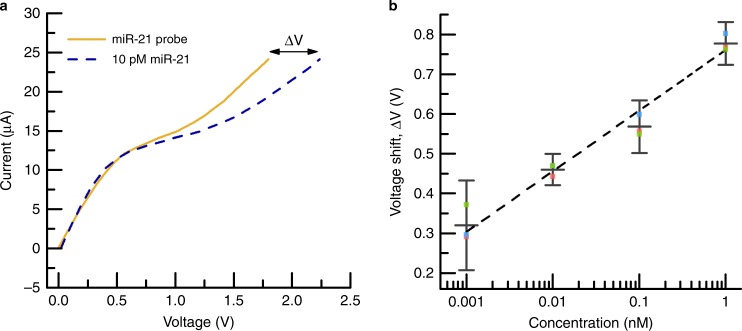
Characterization and calibration of the IEM sensor. a A representative set of CVCs where the current response of the IEM sensor is plotted as a function of voltage. Initially, a CVC is acquired for the IEM sensor functionalized with the miR-21 probe but only in 1× PBS (labeled ‘miR-21 probe’). A CVC is then acquired for the same sensor but in a solution of 1× PBS containing 10 pM miR-21 (labeled ‘10 pM miR-21’). Upon miR-21 hybridization with the probes attached to the IEM, a large voltage shift ΔV occurs in the over-limiting region, and this can be correlated to the miR-21 concentration in solution. b Calibration curve relating the IEM sensor voltage shift (ΔV) to miR-21 concentration where the error bars represent the uncertainty at 95% confidence for three replicates for each point. The dash line is a linear curve fit reflecting log-linear behavior

