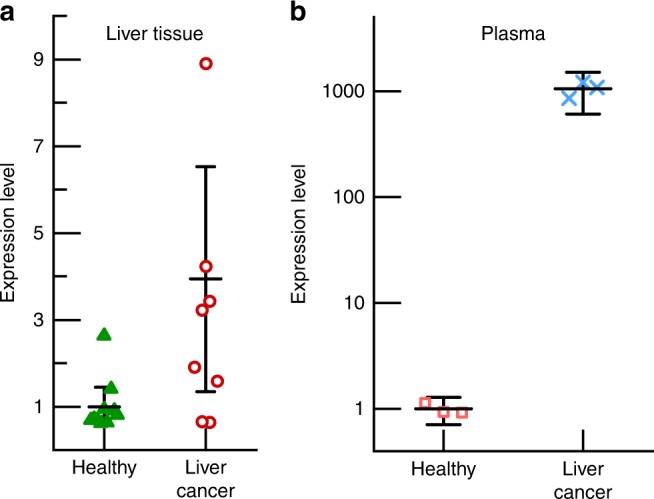
Fig. 5.

Measurement of miR-21 expression a in liver tissues using qPCR and b in plasma using the integrated device for two cohorts of 15-month-old mice, one healthy and one with liver cancer. In plasma, the expression level for the liver cancer group is nearly three orders of magnitude greater than that of the healthy (control) group. For the liver tissue data, the mean reflects the average of ten (healthy) and nine (liver cancer) replicates respectively, and for the plasma, both data sets show the average of three replicates. The error bars represent the uncertainty at 95% confidence in all cases
