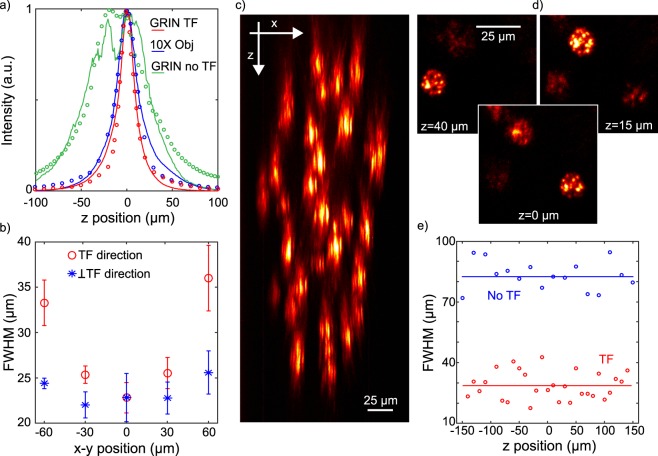
Figure 2.
Spatial resolution of the MTF-CGH spots throughout the FOV of the GRIN lens. (a) Axial profiles (solid curves) and simulations (scattered curve) for a 15 µm holographic spot at the center of the FOV when using the GRIN lens with TF (red), without TF (green) and the 10X objective alone with TF (blue). (b) Position dependent FWHM of one holographic spot displaced along the TF (x) or the perpendicular (y) direction. The data are the average over 6 different repetitions of the same experiment and are given with an error bar calculated as the standard deviation over all the repetitions. (c) Lateral (x-z) view of 28 holographic spots distributed in 3D. (d) In plane (x-y) view of 3 holographic spots at 3 different depths. (e) Comparison of the axial resolutions with TF (28 spots) and without TF (16 spots) as a function of z. For the corresponding plots as a function of x and y see Supplementary Fig. 2.

