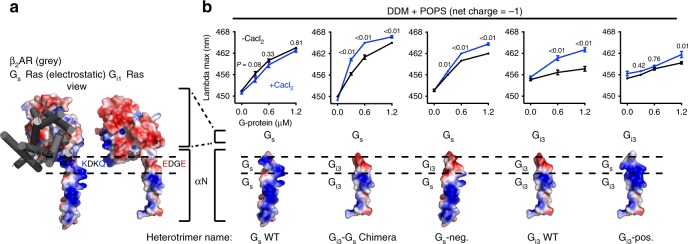
Fig. 3.
Ca2+ interacts with the amino terminal helix of Gi3. a Membrane-facing surfaces of Gs and Gi1 Ras domains, with β2AR shown in gray. The membrane-facing surface of Gi1 was modeled by superimposing the Ras domain of Gi1 (PDB: 1GP270) onto the structure of Gs in complex with β2AR (PDB: 3SN669). Red and blue signify negative and positive charge on G protein, respectively. Dashed lines highlight the region in αN where charge differs: The sequence is KDKQ in WT Gs vs. EDGE in WT Gi1 (and in Gi2, Gi3). b mB−β2AR−G protein dose−response curves ± 10 mM CaCl2. Data were generated with the G protein depicted below the curves: mutations were made in αN and corresponding electrostatic models are shown. Epinephrine was not included in experiments titrating Gs WT, Gi3-Gs Chimera, or Gs-neg. to enhance the effect of CaCl2. Epinephrine (100 μM) was included in experiments titrating Gi3 WT and Gi3-pos. mB−β2AR concentration is 250 nM. Data are mean ± s.e.m. of three independent experiments. Multiplicity adjusted P values were computed by two-way ANOVA followed by Sidak’s post hoc test between CaCl2 conditions. Source data are provided in the Source Data File

