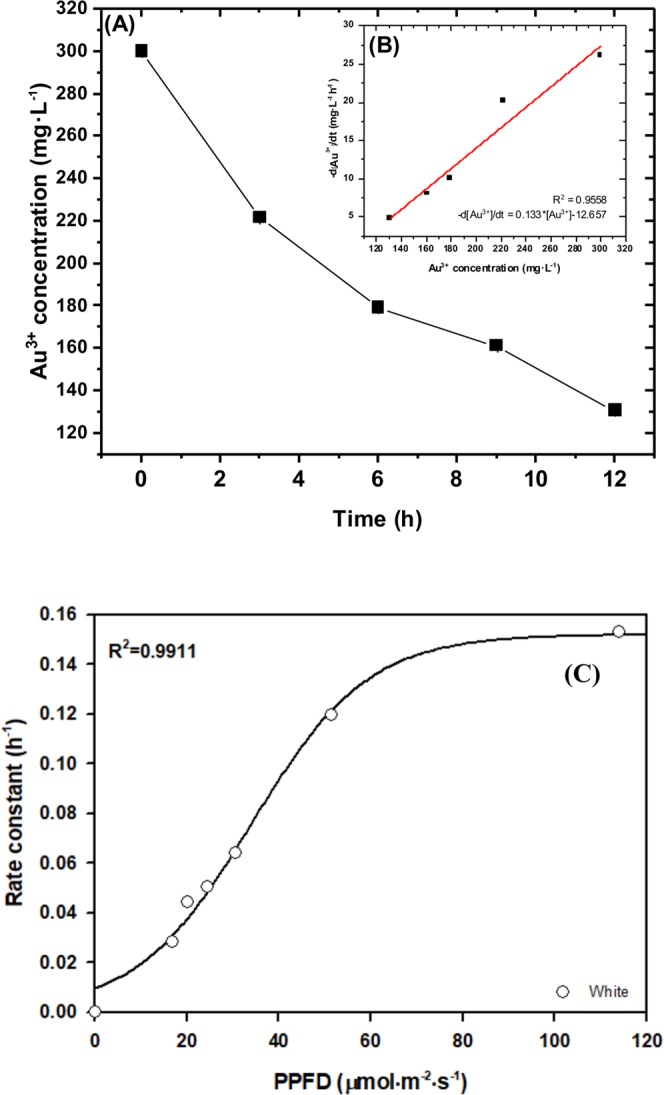
Figure 2.

The kinetic analysis of Au3+ ion reduction by S. oneidensis MR-1. (A) Au3+concentration kinetic curve (B) the reaction rate versus Au3+ ion concentration. All experiments were conducted in triplicate at 25 °C, and the reaction mixture contains 1.2 g/L biomass, Au3+ ion 300 mg/L for initial concentration [Au3+]0 and lactate sodium 50 mM. In this figure, the sample was settled at position 1 (PPFD = 113.9 μmol/m2/s) (C) The correlation between white light intensity and rate constant. Light intensity is defined as photosynthetic photon flux density per unit area, called PPFD, with wavelength ranging from 400–700 nm. The calculation of rate constant is followed by differential equations (Eqs 2–4).
