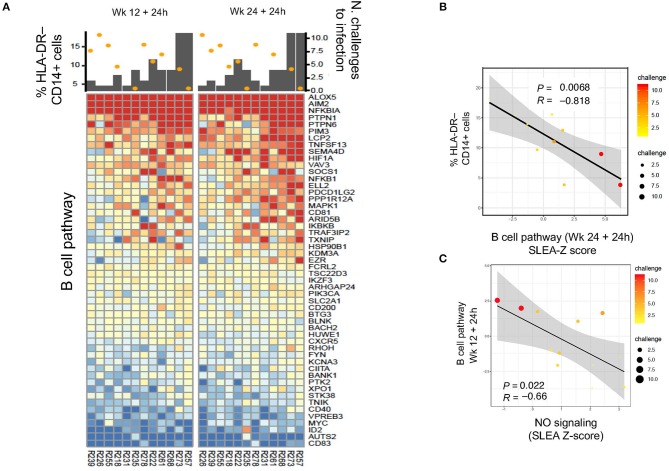
Figure 5.
(A) Heatmap showing log2-fold change (post-vaccination—pre-vaccination) in B cell pathways that are negatively correlated with HLA-DR− CD14+ cell frequency and also correlated with protection from SIV acquisition. (B,C) Sample enrichment analysis was used to summarized per sample the expression of genes part of the B cell pathway. The scatter plots shows the frequencies of HLA-DR−CD14+ cells as a function of the B cell pathway measured 24 h after the 2nd boost (B) and the B cell pathway as a function of the NO pathway (C). The size of the dots is proportional to the number of SIV challenge to infection of the vaccinated animals. A Spearman correlation and t-test was used to test the correlation is different from 0.

