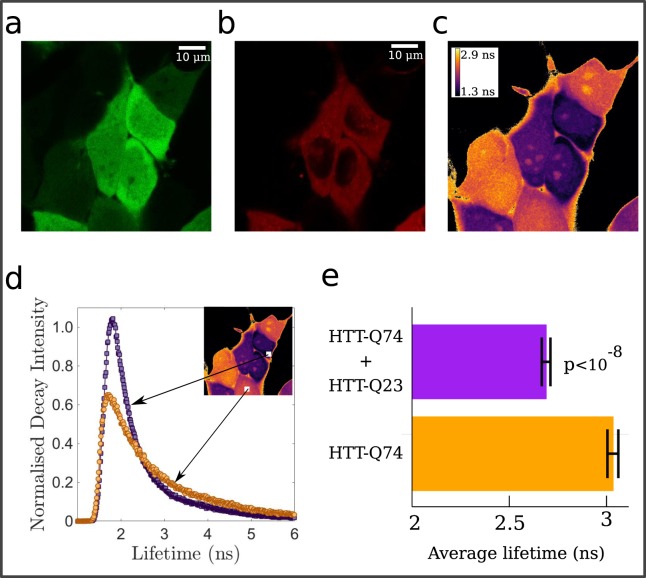
Figure 4.
FLIM-FRET analysis shows heterogeneous aggregation of mutant and wild type HTT. Exemple of EGFP-HTT-74Q (a) and RFP-HTT-20Q (b) signal in HeLa cells. (c) Average EGFP lifetime obtained fitting single-pixel distribution with four exponents. Decay time in pixel with less than 150 counts was set to zero. (d) The decay signal distributions from two regions (30 × 30 pixels) show different exponential tails, in agreement with average lifetime estimates. (e) Average lifetimes calculated from lifetime distribution over regions of 30 × 30 pixels in 11 cells positive to EGFP-HTT-74Q and 14 cells positive to both EGFP-HTT-74Q and RFP-HTT-20Q transfection.

