Fig. 4.
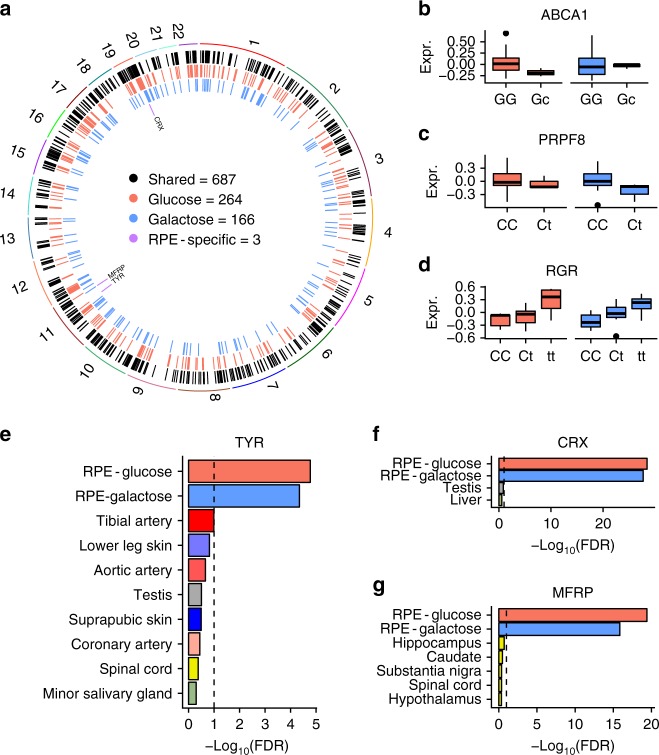
Landscape of genetic regulation of RPE gene expression. a We discovered 687, 264, and 166 eQTLs that are shared, glucose-specific, and galactose-specific, respectively. Comparison with GTEx eGenes revealed three shared eGenes that are currently unique to fRPE. b A glucose-specific eQTL in ABCA1. c A galactose-specific eQTL in PRPF8. d A shared eQTL in RGR. The y-axis of panels b–d denotes normalized expression values. e–g Evidence for fRPE-specificity for three eQTLs compared to GTEx. Black dashed lines indicate FDR = 0.1. Minor alleles are indicated by lowercase. For b, c, and d, each element of the boxplot is defined as follows: centerline, median; box limits, upper and lower quartiles; whiskers, 1.5× interquartile range

