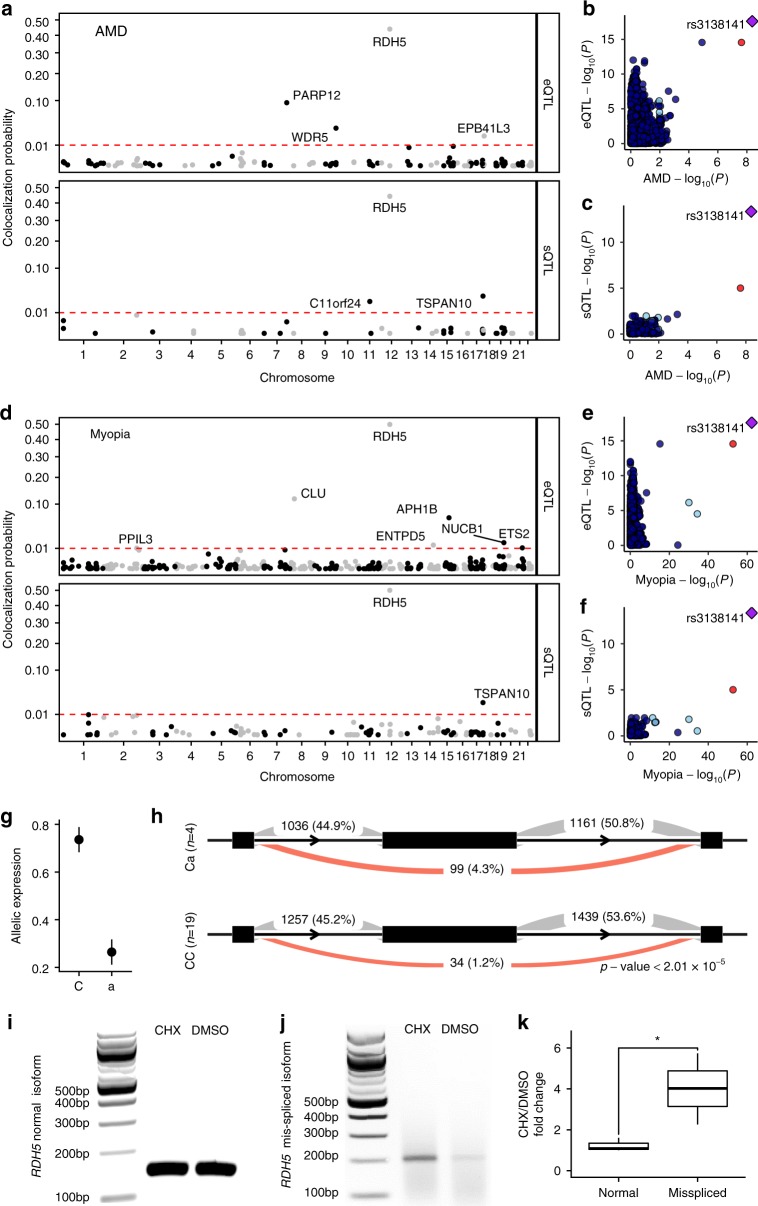
Fig. 5.
Fine mapping of disease-associated variants using fRPE gene regulation. a Colocalization posterior probability for fRPE e/sQTLs with AMD. b, c Scatter plots demonstrate clear colocalization between AMD GWAS signal at rs3138141 and RDH5 eQTL (b) and sQTL (c). d Colocalization posterior probability for fRPE e/sQTLs with myopia. e, f Scatter plots demonstrate clear colocalization between myopia GWAS signal at rs3138141, the same variant identified for AMD, and RDH5 eQTL (e) and sQTL (f). a–f Colocalization results are with glucose QTLs. Galactose QTL colocalizations can be found in Figs. S18–19. g Relative allelic expression estimated by RASQUAL with 95% confidence intervals is shown. h Increased skipping of RDH5 exon 3 (middle black rectangle) is associated with the minor allele at rs3138141. The average read counts are shown for three splice junctions in groups of fRPE cells with different genotypes. The proportion of counts for all three sites for a given junction and genotype is shown in parenthesis. Exon and intron lengths are not drawn to scale. Minor alleles are indicated by lowercase. i Gel image showing RHD5 normal isoform amplified from CHX or DMSO treated ARPE-19 cells. j Gel image showing RHD5 mis-spliced isoform amplified from CHX or DMSO treated ARPE-19 cells. k Relative fold change between CHX and DMSO treatments for normal and mis-spliced RNA isoforms. Error bars indicate standard error of the mean for n = 3 independent experiments. *p < 0.05

