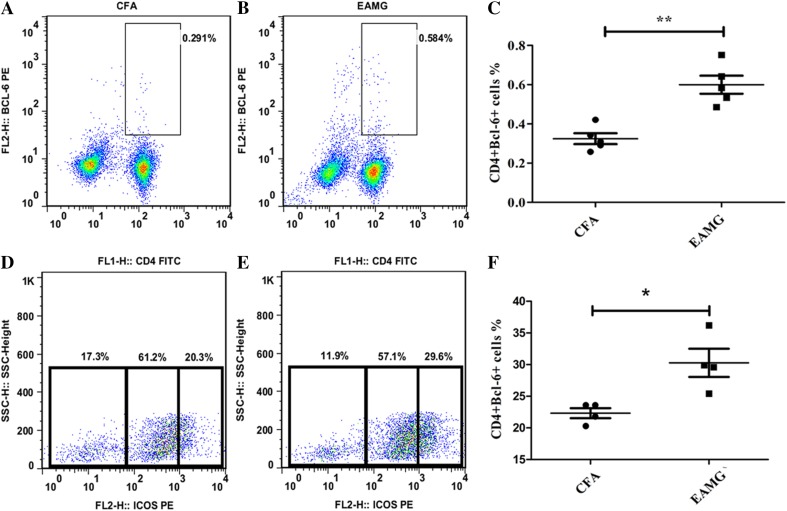
Fig. 4.
Tfh profile during EAMG development. Tfh expression in lymphoid tissues at a late stage of disease measured by flow cytometry. CD4+Bcl-6+ cells (A, B) and CD4+CXCR5+ICOS++ cells (D, E) detected by staining. C, F Percentages of CD4+Bcl-6+ T cells in A and B, and CD4+CXCR5+ICOS++ cells (the left populations in D and E), respectively. Mean ± SD from three independent experiments with 4 to 5 rats per condition per experiment (*P < 0.05, **P < 0.01).

