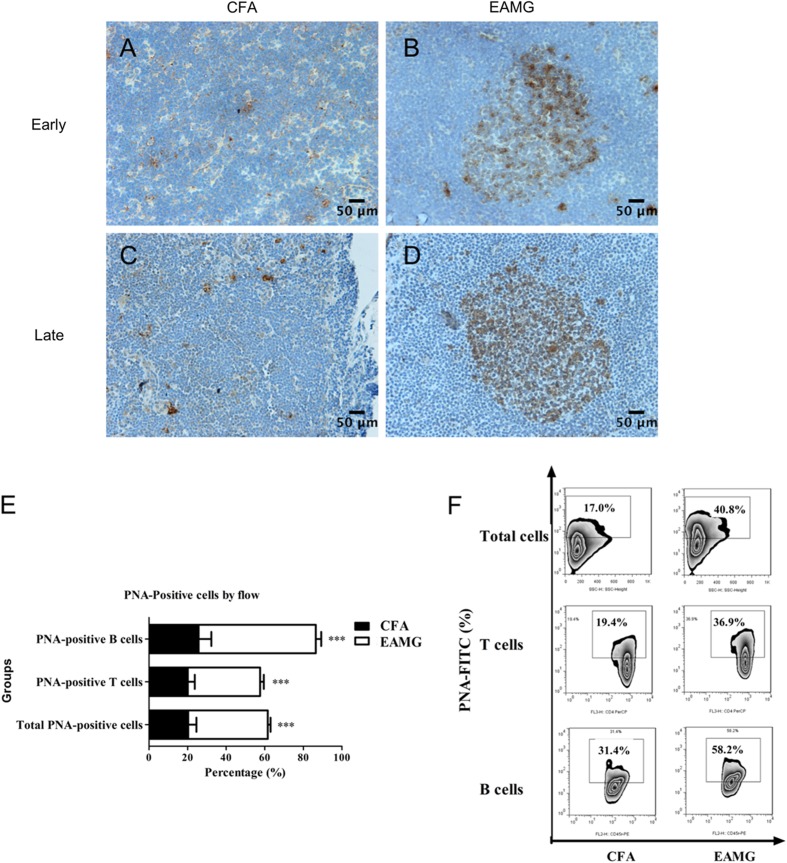
Fig. 7.
GC response. Lymph nodes were resected during the early and late stages of disease and then stained with PNA to identify GCs. A–D Representative images showing the differences in GC size between the two groups (scale bars, 50 μm). E, F T cells, B cells, and total lymphocytes were isolated from lymph node tissue during the late stage of disease, stained for PNA, and analyzed by flow cytometry. The ratios of PNA-positive cells are expressed as the mean ± SD (E, F; ***P < 0.001). Data are from three independent experiments with 3–4 rats per condition per experiment.

