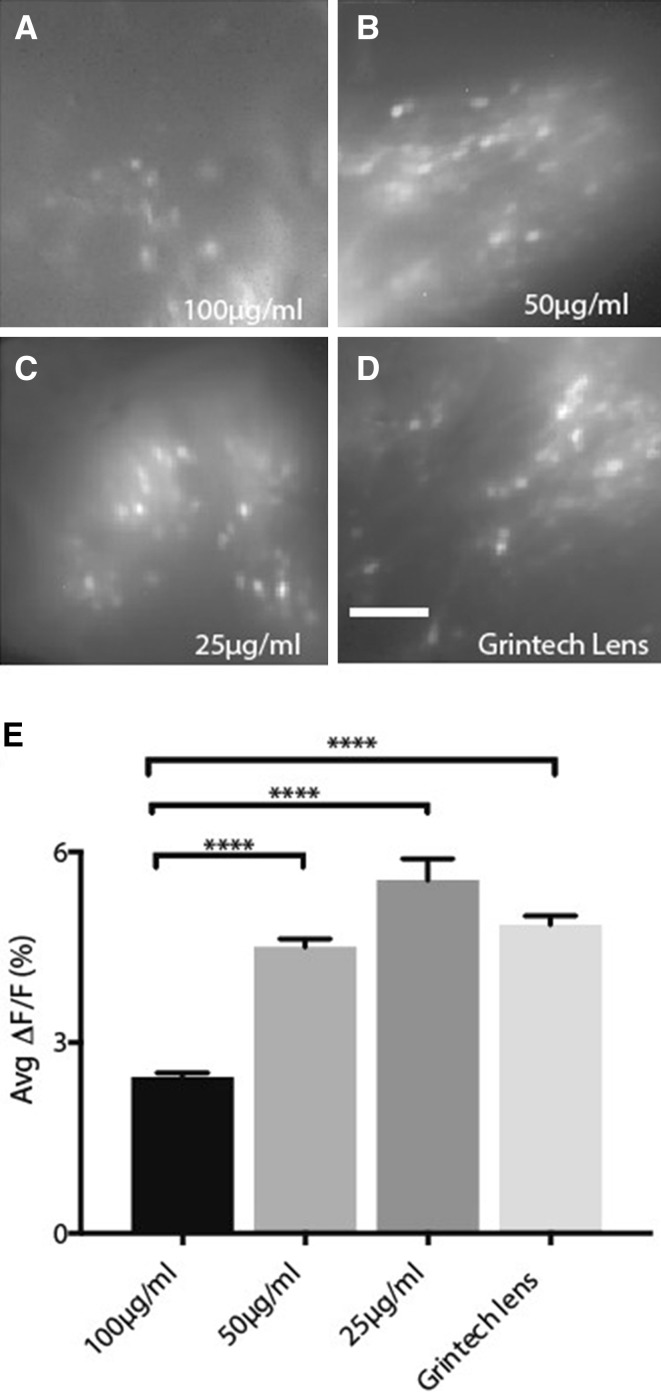
Fig. 3.
Comparison of imaging performance. A–C Representative standard deviation projection images from miniScope recording via GRIN lenses coated with parylene-C and fibronectin at 100 μg/mL (Group 1) (A), 50 μg/mL (Group 2) (B), and 25 μg/mL (Group 3) (C). D Representative standard deviation projection image from miniScope recording via a GrinTech GRIN lens (Group 4). E Average ∆F/F of all the neurons from each group. Group 1: 2.46% ± 0.06%, 96 neurons from two mice; Group 2: 4.50% ± 0.13%, 224 neurons from two mice; Group 3: 5.55% ± 0.34%, 100 neurons from two mice; Group 4: 4.85% ± 0.14%, 366 neurons from three mice. ****P < 0.0001, one-way ANOVA and Tukey’s post hoc test. Histogram bars represent the mean value for all neurons, with error bars representing SEM. Scale bar, 100 μm.

