
Fig. 4.
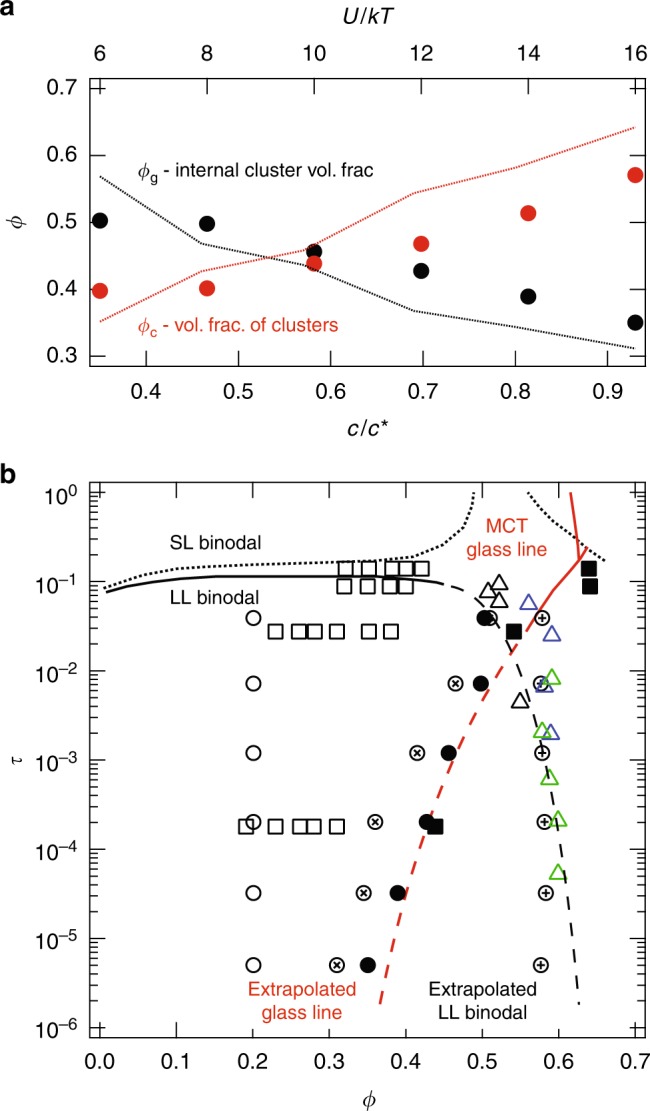
The internal cluster particle concentration. a The cluster densities ϕg (black) and volume fractions of clusters ϕc (red) determined from simulations and application of the graph theory. The lines are approximations of ϕg (black) and ϕc (red) found by substituting the hard sphere equation of state into the Cauchy-Born theory with 〈r2〉 = ξ2/15 and G′ given by the simulation results. Nearly identical values are found when using the experimentally determined modulus. b Initial volume fraction and reduced temperature of gel samples (open circles) and cluster densities ϕg determined in this work (closed circles, graph theory; circle-x, hard sphere equation of state). The square symbols reproduce the data of Ramakrishnan et al.10 with open squares the experimentally measured particle volume fraction and closed squares the cluster densities inferred from application of the Cauchy-Born theory with the hard-sphere equation of state. The attractive and repulsive glass lines with a bilinear shift from the mode coupling theory (MCT) are drawn in solid red35,36 while an extrapolation through the experimental data is indicated with the dashed red line. The AHS phase boundaries with the fluid-solid coexistence lines for a/Rg = 10 6 are given by short dashed black lines. Fluid-fluid coexistence is indicated by the solid black line and its extrapolation by the dashed black line. The local volume fraction of particle-rich regions (shown as open circle-plus) is compared with values from ref. 9: blue triangles are ϕ = 0.13 and δ = 0.059, green triangles are ϕ = 0.045 and δ = 0.018, and black triangles are ϕ = 0.045 and δ = 0.059, where δ is the range of the attraction relative to the particle radius