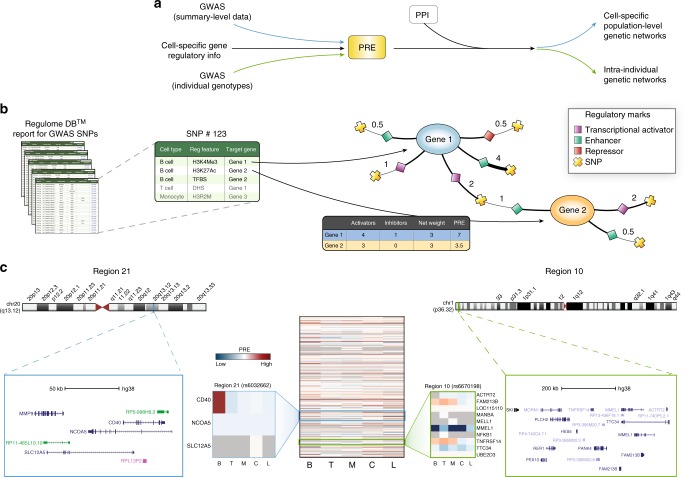
Fig. 1.
Overall strategy and computation of the predicted regulatory effect (PRE) in MS-associated loci. a GWAS signals were integrated with cell-specific regulatory information to compute PRE at both population and individual level. In a second stage, genes with high PRE at each of the cell types analyzed were identified in a human protein interactome (PPI) and sub-networks of enriched genes (proteins) were extracted. b Each MS-associated SNP and those in LD were used as query in RegulomeDB. For each SNP, the all regulatory features were annotated and classified according to type and cell of origin. A graph connecting every queried SNP (crosses), the regulatory feature (diamonds), and the target gene (circles) was created and the number of experiments supporting a particular regulatory feature was used as weight (numbers next to SNP). Finally, a PRE score was computed for each gene by summing up weights from all incoming regulatory signals for each of the cell types analyzed. c Heatmap represents the PRE of all genes under GW MS-associated loci for cells of interest. Rows represent genes, and columns denote cell types. Colors indicate positive (red), neutral (white) and negative (blue) PRE values. Two representative regions are highlighted. Region 10 (associated SNP: rs6670198, green box) highlights immune-specific (B, T, and M) regulation of FAM213B and TNFRSF14. In contrast, region 21 (associated SNP rs6032662, blue box), shows high PRE only for CD40 in B cells. C: CNS; L: lung; T: T cells; M: monocytes; B: B cells. This analysis represents all SNPs with an r2 > 0.5 of the main GW effect

