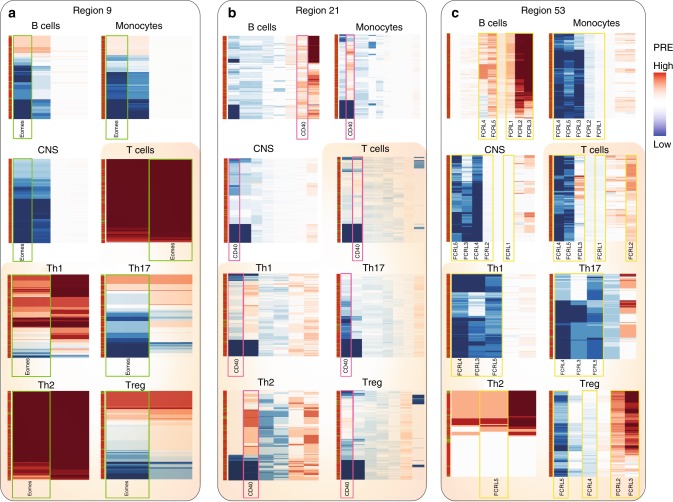
Fig. 4.
Individualized PRE computations for three representative associated regions. Each row represents an individual (out of 2370 cases and 412 controls), and each column represents a gene within the associated region. Region 9 (a) contains the gene EOMES (green boxes), region 21 includes CD40 (pink boxes) (b) and region 53 (c) the FC receptor-like cluster (yellow boxes). The leftmost column denotes subject status (red: cases; green: controls)

