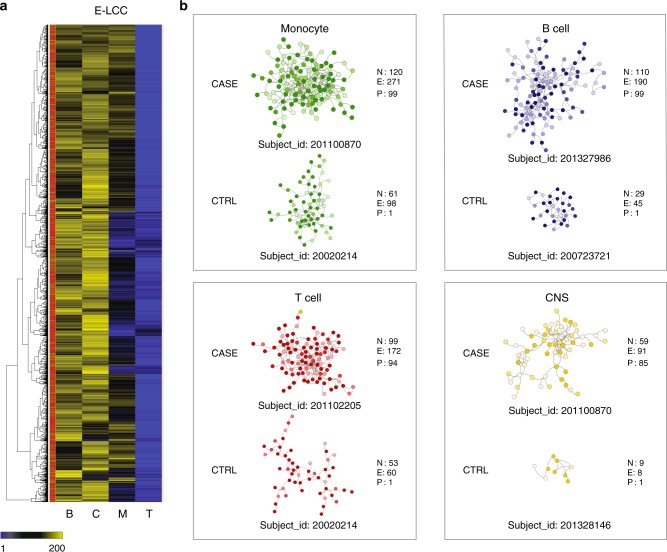
Fig. 5.
Select case-control intra-individual MS-risk networks. a Number of edges in the largest connected component (LCC) of the network generated among proteins (genes) with high PRE (>25th percentile) in 2370 patients and 412 healthy controls (GW_r2 > 0.5). Each row represents a subject, each column represents a cell type (B: B cell; T: T cell; M: monocyte; c: CNS). The leftmost column indicates subject status (red: cases; green: controls). b Representative sub-networks from subjects at the extremes of the distribution for E-LCC for each cell type. For each network, the number of nodes (N), edges (E), and percentile relative to all subjects (P) is indicated. The intensity of node color is proportional to the PRE of each gene in the corresponding cell type

