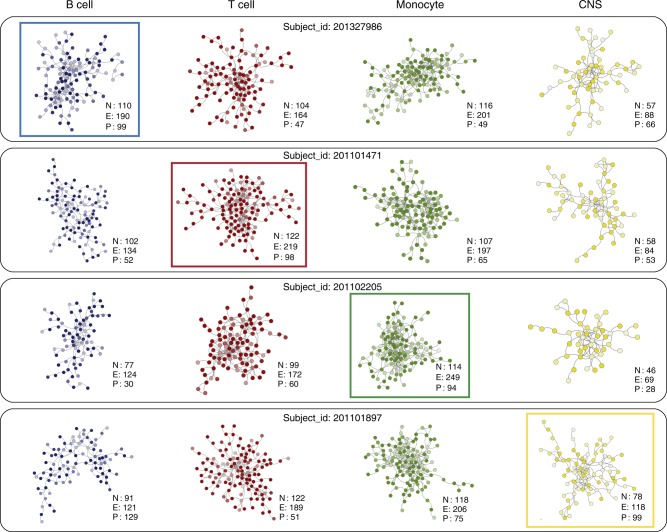
Fig. 6.
Heterogeneity in intraindividual MS-risk networks Intraindividual cell-specific networks of four representative MS subjects showing heterogeneity of risk across all cell types. a Cell specific risk networks for subject_id: 201327986. b Cell specific risk networks for subject_id: 201101471. c Cell specific risk networks for subject_id: 201102205. d Cell specific risk networks for subject_id: 201101897. For each subject, the most connected risk network (number of edges in the highest percentile across all subjects) is highlighted within a colored box. For each network, the number of nodes (N), edges (E), and percentile relative to all subjects (P) is indicated. The intensity of node color is proportional to the PRE of each gene in the corresponding cell type. M: monocyte, green; T: T cells, red; B: B cells, blue, C: CNS, yellow

