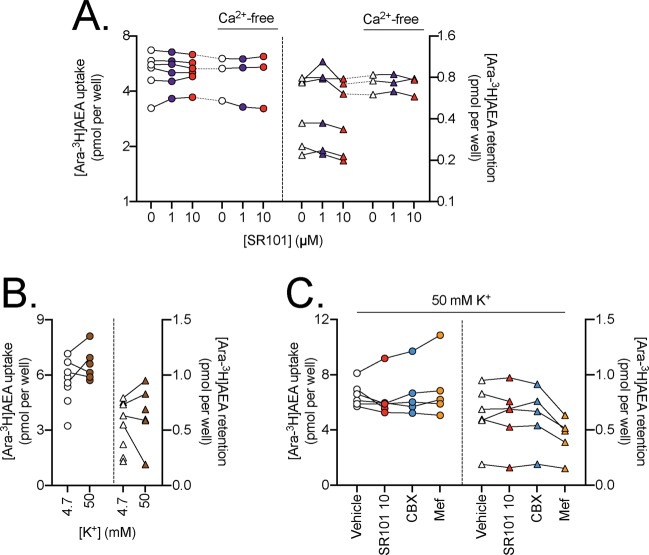
Figure 5.
Panel A. Effect of preincubation for 10 min with SR101 upon the uptake of 100 nM [Ara-3H]AEA by T84 cells and the retention by wells alone, assays either in the presence or absence of Ca2+ in the medium. Data for each experiment and cell line are connected by the lines, N = 3–6. The data points for the cells relate to the left y-axes, and the data points for the wells relate to the right y-axes. One-way randomised block ANOVAe with Geisser-Greenhouse-adjusted degrees of freedom gave P values of: cells, 0.95 and 0.61; wells 0.051 and 0.57 for normal and Ca2+-free, respectively. The matching of the samples was significant (P ≤ 0.0034). Panel B. Comparison of 100 nM [Ara-3H]AEA in T84 cells and retention by wells for the assay [K+] shown. Matched data are shown (4 pairs out of 10 experiments). P values, calculated using a partially overlapping t-test, were: cells, 0.086; wells, 0.30. Panel C. Effect of preincubation for 10 min with SR101 (10 µM), 30 µM CBX and 30 µM Mef upon the uptake of 100 nM [Ara-3H]AEA by T84 cells and the retention by wells alone, assays conducted at 50 mM K+ (N = 6 for vehicle and SR101, N = 5 for CBX and Mef). Mixed-effects analyses matching for the experiment gave P values for treatment of 0.36 and 0.18, for cells and wells, respectively. In both cases, the matching was significant (P < 0.0001).

