
Figure 6.
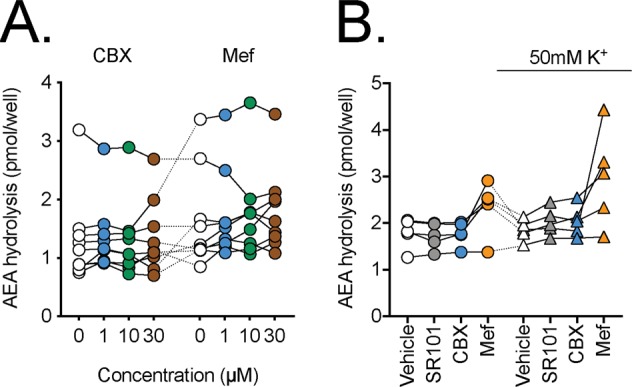
The effects of SR101, CBX or Mef upon the hydrolysis of 100 nM [Et-3H]AEA by T84 cells. The cells were preincubated for 10 min with test compounds or vehicle prior to addition of [Et-3H]-AEA and incubation for a further 15 min at 37 °C. Data for each experiment are connected by the lines. Panel A, concentration-response curves for CBX and Mef (N = 9). A randomised block ANOVAe with Geisser-Greenhouse-adjusted degrees of freedom gave P values of: 0.66 and 0.37 for CBX and Mef, respectively. In both cases, the matching was significant (P < 0.0001). In Panel B, concentrations used were 10 µM for SR101, 30 µM for CBX and 30 µM for Mef (N = 5). A two-way randomised block ANOVAe with Geisser-Greenhouse-adjusted degrees of freedom gave P values of: test compound, 0.013; K+ concentration, 0.47; test compound x K+ concentration 0.055.