Fig. 3.
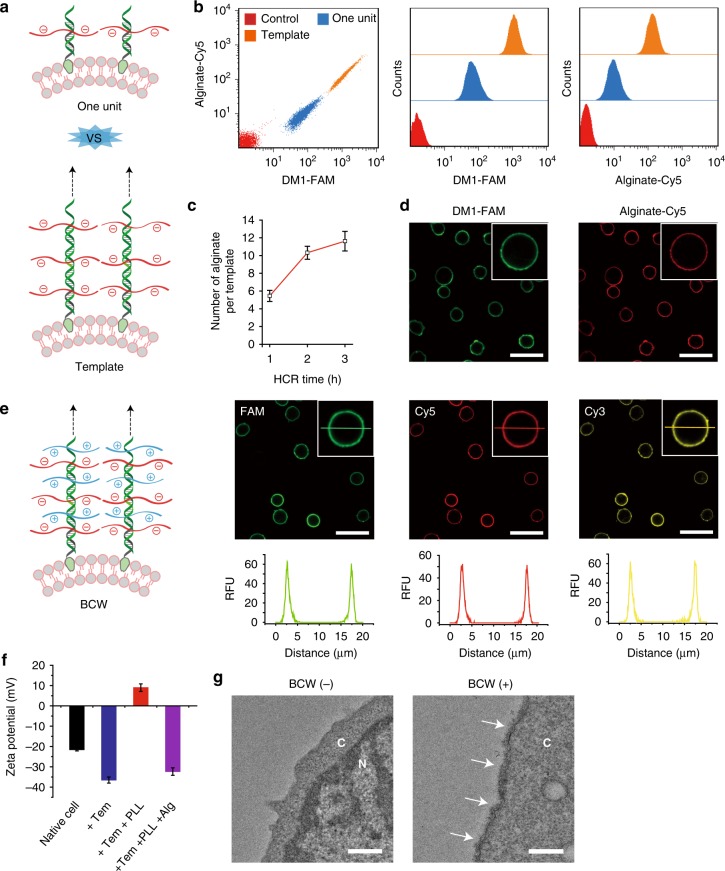
Synthesis and characterization of BCW on mammalian cells. a Schematic comparison between the framing template and the one-unit structure. b Examination of the template on the cell surface using flow cytometry. DM1 was labeled with FAM and alginate was labeled with Cy5. c Effect of reaction time on alginate assembly. d Confocal fluorescence images of the template on the cell surface. e Schematic illustration and confocal fluorescence images of BCW on live cells. DM1, alginate, and polylysine were labeled with FAM, Cy5, and Cy3, respectively. A representative line was drawn horizontally through the center of the cell for showing fluorescence distribution. Scale bar: 30 μm. f Zeta potential of the cell surface at each step during the formation of BCW. Tem, template; PLL, polylysine; Alg, alginate. g Examination of BCW on the cell surface using TEM. Cytosol is represented by C and nucleus is represented by N. BCW is indicated by the arrows. Scale bar: 500 nm. Data are presented as mean ± standard deviation as indicated by error bars (n = 3)

