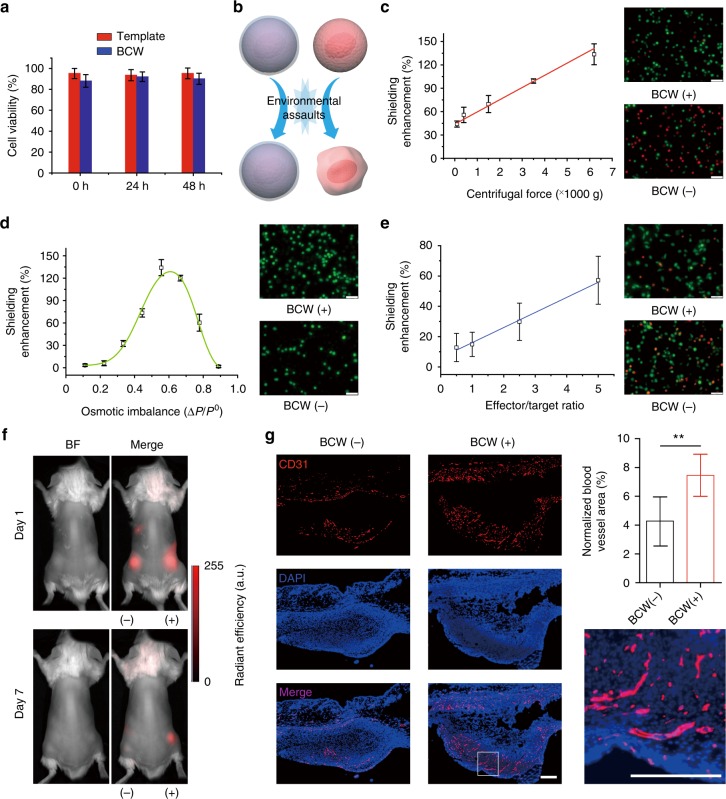
Fig. 5.
Evaluation of shielding enhancement. a Examination of cell viability at different time points. The viability of native cells was used as 100%. 0 h: analysis of the cells right after the synthesis of the template or BCW. b Schematic comparison of the cells covered with (bottom) or without (top) BCW when exposed to environmental assaults. c Shielding enhancement-centrifugal force relationship. After the assault, the cells were cultured and examined with the LIVE/DEAD staining. Green: live; red: dead. Representative images were taken after the cells were exposed to the centrifugal force of 6200×g. d Shielding enhancement-osmotic imbalance relationship. The cells were stained with Calcein-AM (green) for imaging before exposed to the conditions of osmotic imbalance. Representative images were taken after the cells were incubated in the solution of 0.4% NaCl. CCRF-CEM was used for Fig. 5a–d. e Shielding enhancement-immune attack relationship. K562 and NK-92MI were used as target and effector cells, respectively. Representative images were taken at the 2.5:1 effector/target ratio. Green: CFSE. Red: dead cells. Scale bars: 50 μm. Data are presented as mean ± standard deviation as indicated by error bars (n = 3). f In vivo imaging of human bone marrow MSCs subcutaneously transplanted into the mice. MSCs expressed red fluorescence protein (RFP). BF, bright field. (−): naked cells (without BCW); (+): BCW-covered cells. Color-coding of fluorescence intensity in arbitrary units (a.u.) is equally scaled for the images. g Staining of endothelial cells using a mouse-specific anti-CD31 antibody. **p < 0.01. The paired Student’s t-test was used to compare the two groups. Scale bars: 200 μm. Data are presented as mean ± standard deviation as indicated by error bars (n = 6)

