Fig. 3.
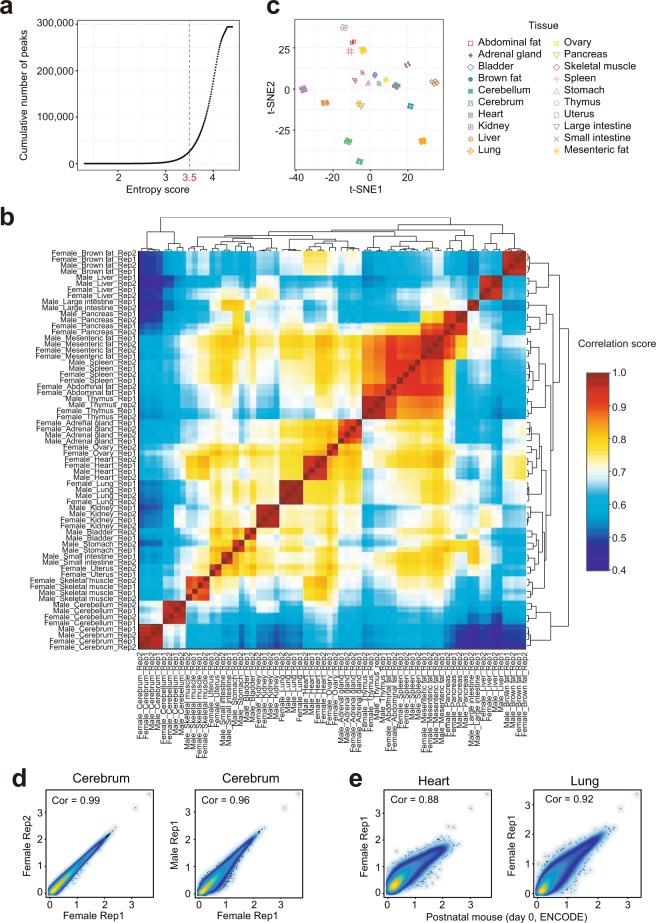
Evaluation of reproducibility across the ATAC-seq datasets. (a) The distribution curve of peak entropy scores. (b) Heatmap clustering of correlation coefficients across all 66 tissue ATAC-seq profiles. (c) t-SNE plot of all 66 ATAC-seq profiles based on the 26,916 tissue-specific peaks. (d) Scatter plots showing the Pearson correlations between technical (left) and biological (right) replicates. (e) Scatter plots showing the Pearson correlations between ENCODE postnatal mouse (day 0) datasets and our ATAC-seq profiles.

