Fig. 3.
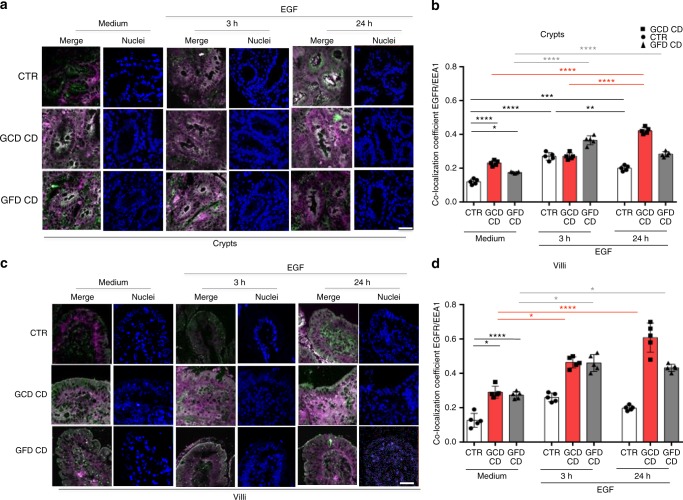
EGFR was localized more in the early vesicular compartment of enterocytes from patients with CD respect to controls after culture of small intestinal biopsies with EGF. Biopsies from patients with CD and controls were cultured in the presence of EGF to monitor the degradation of the EGF/EGFR complex. a Images of immunofluorescence staining of crypts from biopsies of patients and controls cultured in medium alone (Medium) for 24 h or in the presence of EGF for 3 or 24 h. The white color in the merge panels indicates co-localization of EGFR (magenta) and EEA1 (green). Representative fields. Scale bar = 20 µm. b Statistical analysis of the co-localization coefficient of EGFR with EEA1 in crypts as indicated. c Images of immunofluorescence staining of villi from biopsies of patients and controls cultured in medium alone (medium) for 24 h or in the presence of EGF for 3 or 24 h. The white color in the merge panels indicates co-localization of EGFR (magenta) and EEA1 (green). Representative fields. Scale bar = 20 µm. d Statistical analysis of the co-localization coefficient of EGFR with EEA1 in villi as indicated. In all experiments, five subjects in each group of patients, GCD CD, GFD CD and CTR, were examined. Three independent experiments were performed on samples from each group. Columns represent the means and bars represent standard deviations. One-way ANOVA Bonferroni corrected. *p < 0.05, **p < 0.01, ***p < 0.001

