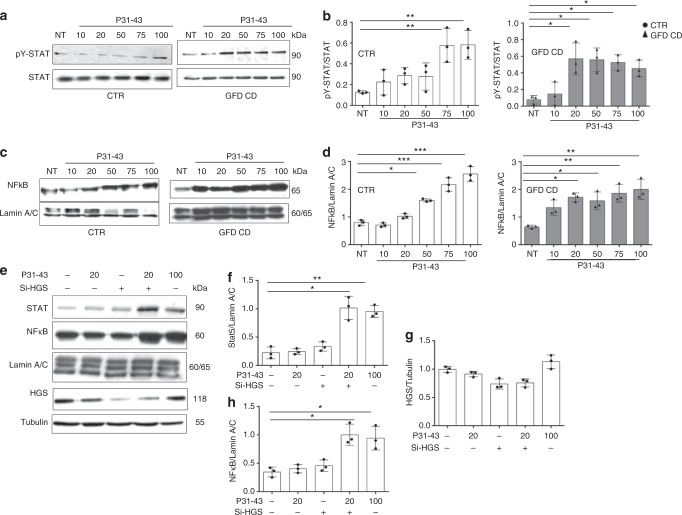
Fig. 9.
Celiac fibroblasts and siHGS control fibroblasts were more sensitive to the P31-43 treatment than control cells. a, b Dose response curve of STAT 5 phosphorylation in response to treatment with increasing P31-43 concentrations (10, 20, 50, 75, or 100 µg/ml) for 30 min. a WB analysis of proteins from total lysates from CTR and CD fibroblasts blotted with anti-STAT 5 and anti-pY STAT 5 antibodies, as indicated. Representative blots. b Densitometry analysis of WBs of samples from 3 patients and 3 controls. Columns represent the means and bars represent standard deviations. c, d Dose response curve of nuclear NFκB in response to treatment with increasing P31-43 concentrations (10, 20, 50, 75, or 100 µg/ml) for 30 min. c WB analysis of proteins from nuclear fraction, from CTR and CD fibroblasts blotted with antibodies anti-NFκB and anti-lamin A/C, used as nuclear proteins loading control, as indicated. Representative blots. d Densitometry analysis of WBs of samples from 3 patients and 3 controls. Columns represent the means, and bars represent standard deviations. e–h Cooperation of low doses of siHGS and P31-43 on STAT 5 and NFκB activation in control cells. STAT 5 and NFκB nuclear fraction in response to treatment with inactive (20 µg/ml) or active (100 µg/ml) doses of P31-43 in CTR fibroblasts before and after silencing HGS (25 ng siHGS). e WB analysis of proteins from cytosol fraction blotted with antibodies anti-HGS, anti-tubulin (citosol loading control), and of proteins from nuclear fraction blotted with antibodies anti-STAT 5 and anti-NFκB and anti-lamin A/C (nuclear loading control), as indicated. Representative blots are shown. f–h Densitometry analysis of WBs of samples from 3 controls. Columns represent the means, and bars represent standard deviations. One-way ANOVA Bonferroni corrected. *p < 0.05, **p < 0.01, ***p < 0.001

