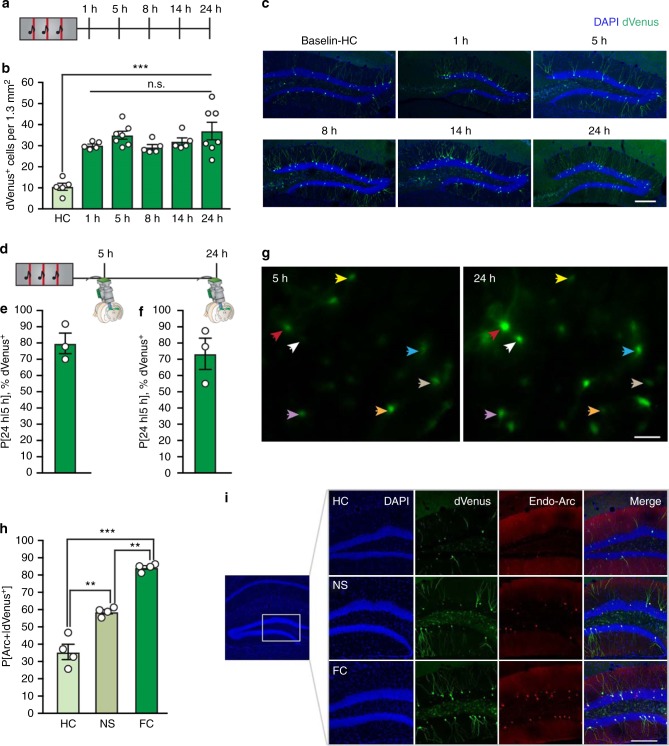
Fig. 1.
Activity-dependent, sustained expression of Arc::dVenus in DG granule cells. a Experimental setup. Arc::dVenus mice were fear conditioned and the number of dVenus+ cells was measured in the DG at successive time-points; 1 h (n = 5), 5 h (n = 7), 8 h (n = 5), 14 h (n = 5) and 24 h (n = 7), after training. Home-cage (HC) controls (n = 5) serve as a baseline. b Number of dVenus+ cells per 1.3 mm2 section in the DG, at specific time-points after fear conditioning. Analysis of variance: effect of training history over baseline (HC): F(1,33) = 13.102, P = P = 1.0 × 10⁻⁵; post hoc LSD: HC vs. 1 h: P = 2.2 × 10⁻⁵, HC vs. 5 h: P = 1.9 × 10⁻⁵, HC vs. 8 h: P = 4.0 × 10⁻⁵, HC vs. 14 h: P = 6.0 × 10⁻⁶, HC vs. 24 h: P = 4.5 × 10⁻⁸. c Representative images of the DG from fear conditioned mice at each successive time-point after fear conditioning. Scale bar: 200 μm. d Animals were implanted with microendoscopes to longitudinally monitor in vivo dVenus fluorescence in the DG (n = 3). e Percentage of dVenus+ cells at 5 h that also express dVenus 24 h after fear conditioning. f Percentage of dVenus+ cells at 24 h that also expressed dVenus 5 h after fear conditioning. g Representative microendoscopy images of dVenus+ cells at 5 and 24 h. Colored arrows indicate cells expressing dVenus at both time-points. Scale bar: 100 μm. h Percentage of dVenus+ cells in the DG that also express endogenous Arc in home-cage controls (HC, n = 4), no shock controls (NS, n = 4) or fear conditioned animals (FC, n = 4). Multivariate analysis of variance: F(2,12) = 40.2, P = 0.0003, post hoc LSD: HC vs. NS: P = 0.006, HC vs. FC: P = 0.0001, NS vs. FC: P = 0.003. i Representative images demonstrating co-expression of endogenous Arc and dVenus. *P < 0.05, **P < 0.01, ***P < 0.001. Data are presented as mean ± SEM. Scale bar: 200 μm. Source data are provided as a Source Data file

