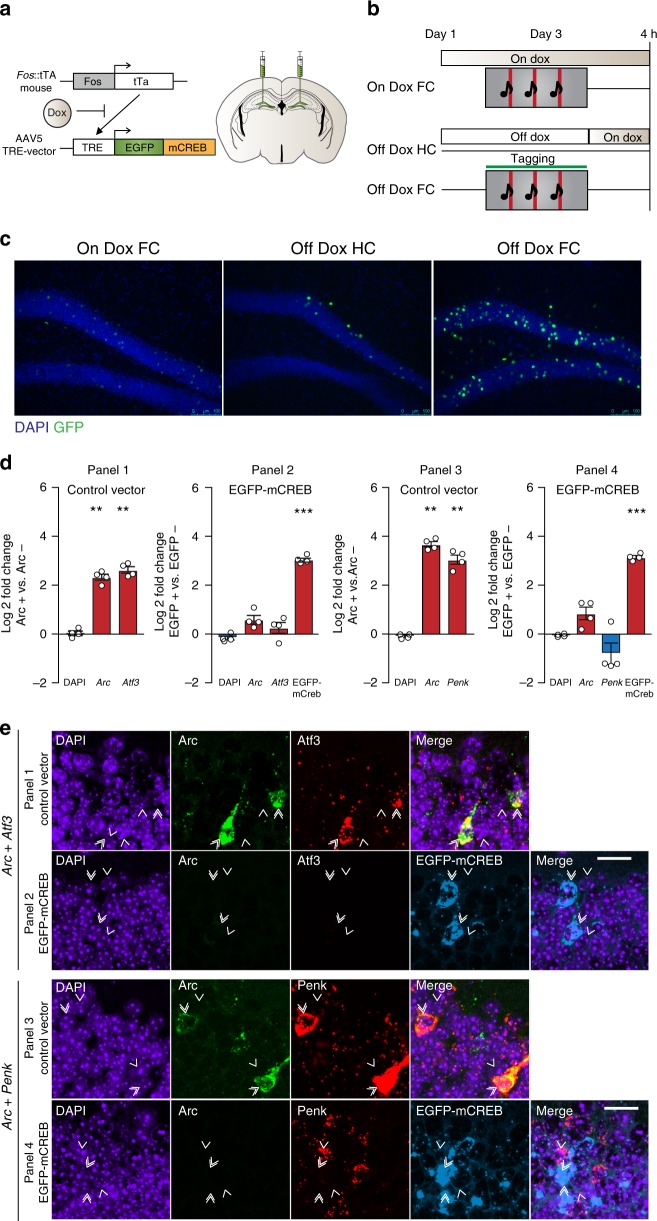
Fig. 4.
Disruption of CREB function prevents regulation of CREB target genes. a Experimental design. Fos::tTA mice were injected with AAV5-TRE::EGFP-mCREB targeting the DG. b On-Dox FC group remained on Dox throughout the experiment, while the off-Dox (HC and FC) groups were placed back on Dox immediately after training. Animals were sacrificed 4 h post-training. c Representative images demonstrating expression of EGFP-mCREB in DG neurons after fear conditioning. FC training on Dox induced very low expression of Fos::tTa driven EGFP-mCREB. Among animals off Dox, fear-conditioned animals (FC) showed much higher EGFP-mCREB expression than HC controls. Scale bar: 100 μm. d Multiplex RNA-scope experiments validate the use of mCREB to disrupt the expression of CREB target genes. Log2 fold change of fluorescence intensity between Arc+ and neighboring Arc− cells is reported for the control vector and EGFP+ vs. EGFP− cells for mCREB injected animals. Analysis of variance: Panel 1 and 2-Control vector (n = 4): Arc: F(1,7) = 51.64, P = 3.7 × 10⁻⁴, Atf3: F(1,7) = 22.16, P = 3.3 × 10⁻³. EGFP-mCREB vector (n = 4): EGFP: F(1,7) = 79.13, P = 1.1 × 10⁻⁴. Panel 3 and 4-Control vector (n = 4): Arc: F(1,7) = 14.45, P = 8.9 × 10⁻³, Penk: F(1,7) = 42.60, P = 6.2 × 10⁻⁴. EGFP-mCREB vector (n = 4): EGFP: F(1,7) = 96.21, P = 6.5 × 10⁻⁵. *P < 0.05, **P < 0.01, ***P < 0.001. Data are presented as mean ± SEM. Source data are provided as a Source Data file. e Representative images demonstrating co-expression patterns of Arc (green) and Atf3 (red) or Arc (green) and Penk (red) in animals injected with the control vector (panels 1 and 3) and EGFP-mCREB (cyan, panels 2 and 4) in the DG of animals injected with the EGFP-mCREB virus. DAPI (blue) labels all cells. Double arrows indicate Arc+/EGFP+ cells, while single arrows indicate neighboring Arc−/EGFP− cells. Scale bar: 20 μm

