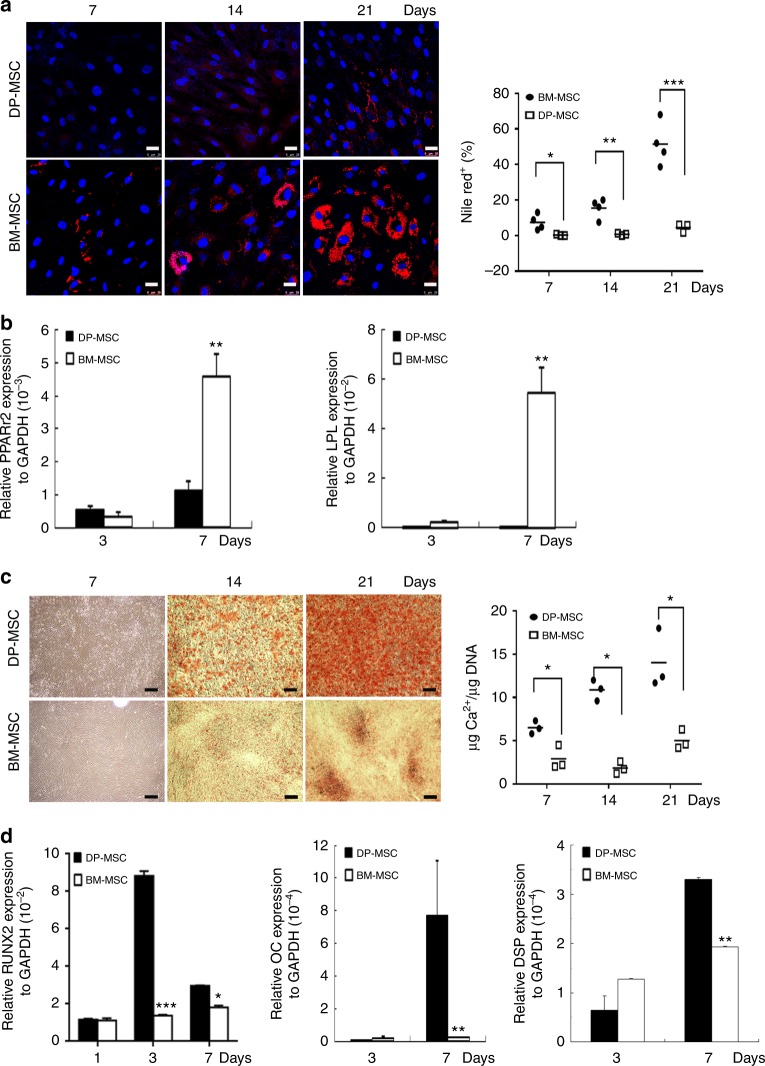
Fig. 1.
DP-MSCs decrease in adipogenesis and increases in osteogenesis. Comparison of adipogenic (a, b) and osteogenic potential (c, d) between DP-MSCs and BM-MSCs. a Cells were induced in an adipogenic induction medium for up to 21 days. (Left) Cells were stained by nile red, and (Right) quantification of the nile red positive cell percentages. Bar = 25 μm. b Quantitative RT-PCR for mRNA levels at indicated time of adipogenic differentiation. c Cells were induced in an osteogenic induction medium for up to 21 days. (Left) Cells were analyzed by Arsenazo III kit, and (Right) the calcium contents were quantified relative to DNA contents. d Quantitative RT-PCR for mRNA levels at indicated time of osteogenic differentiation. Results are expressed as the mean ± SD of three independent experiments. *p < 0.05; **p < 0.01 versus DP determined by Student’s t-test. Bar = 200 μm

