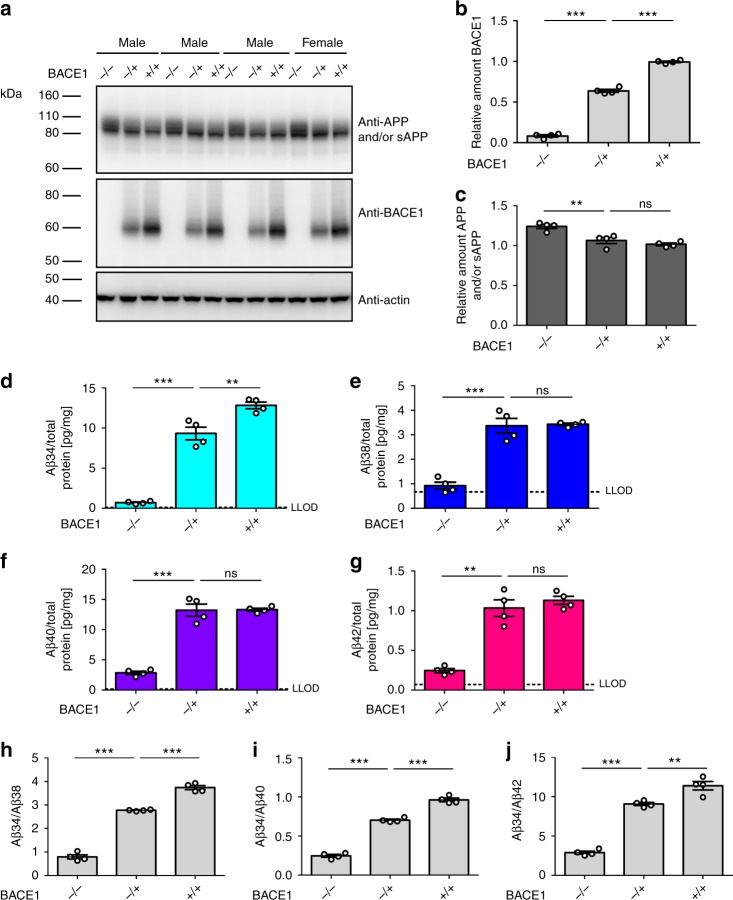
Fig. 1.
Endogenous BACE1 generates Aβ34 in the murine brain. Endogenous levels of murine APP and/or sAPP, BACE1, and Aβ in BACE1−/−, BACE1+/−, and wild-type littermates (+/+). N = 4 animals per group. Western blot of endogenous APP and/or sAPP and BACE1 expression in male and female mice (a) and corresponding quantification of relative protein amounts of BACE1 (b) and APP and/or sAPP (c). Quantification (pg/mg total protein) of absolute amounts of Aβ34 (d), Aβ38 (e), Aβ40 (f), and Aβ42 (g) as determined by custom 4-plex MSD multiplexing assays. Ratios of Aβ34/Aβ38 (h), Aβ34/Aβ40 (i), and Aβ34/Aβ42 (j) are displayed. Statistics: b one-way ANOVA, F(2, 9) = 1021, p < 0.0001, c one-way ANOVA, F(2, 9) = 17.28, p < 0.001, d one-way ANOVA, F(2, 9) = 145.7, p < 0.0001, e one-way ANOVA, F(2, 9) = 53.68, p < 0.0001, f one-way ANOVA, F(2, 9) = 95.65, p < 0.0001, g one-way ANOVA, F(2, 9) = 49.70, p < 0.0001, h one-way ANOVA, F(2, 9) = 425.2, p < 0.0001, i one-way ANOVA, F(2, 9) = 378.0, p < 0.0001, j one-way ANOVA, F(2, 9) = 157.6, p < 0.0001. Bars and error bars indicate mean ± s.e.m. Tukey’s post-hoc tests were performed for pairwise comparisons; selected comparisons are highlighted ***p < 0.001, **p < 0.01, ns = nonsignificant p > 0.05. For each target, the MSD software computes the lower limit of detection (LLOD) as 2.5 standard deviations above the blank

