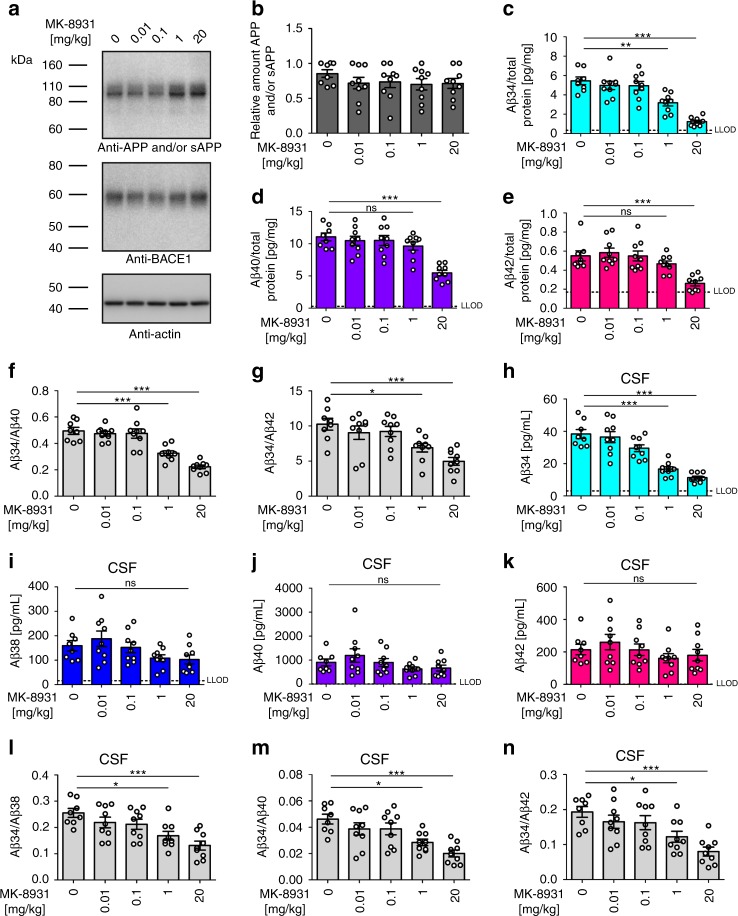
Fig. 2.
Pharmacological inhibition of Aβ34 generation in rats. Endogenous levels of APP and/or sAPP, BACE1, and Aβ in rats 1 h after intravenous injection of the indicated concentrations (mg/kg) of the BACE1-specific inhibitor (MK-8931) n = 9 animals per group or vehicle n = 8 animals. Western blot of endogenous APP and/or sAPP and BACE1 expression (a) and corresponding quantification of relative protein amounts of APP and/or sAPP (b). Quantification (pg/mg total protein) of absolute amounts of Aβ34 (c), Aβ40 (d), and Aβ42 (e) as determined by custom MSD multiplexing assays. Ratios of Aβ34/Aβ40 (f) and Aβ34/Aβ2 (g) are displayed. Quantification of CSF levels of Aβ34 (h), Aβ38 (i), Aβ40 (j), and Aβ42 (k), as well as display of the ratios Aβ34/Aβ38 (l), Aβ34/Aβ40 (m), and Aβ34/Aβ42 (n). Statistics: b one-way ANOVA, F(4, 39) = 0.63, p > 0.05, c one-way ANOVA, F(4, 39) = 22.40, p < 0.0001, d one-way ANOVA, F(4, 39) = 12.81, p < 0.0001, e one-way ANOVA, F(4, 39) = 9.38, p < 0.0001, f one-way ANOVA, F(4, 39) = 25.93, p < 0.0001, g one-way ANOVA, F(4, 39) = 8.02, p < 0.0001, h one-way ANOVA, F(4, 39) = 26.55, p < 0.0001, i one-way ANOVA, F(4, 39) = 2.69, p < 0.05, j one-way ANOVA, F(4, 39) = 1.71, p > 0.05, k one-way ANOVA, F(4, 39) = 1.09, p > 0.05, l one-way ANOVA, F(4, 39) = 6.87, p < 0.001, m one-way ANOVA, F(4, 39) = 7.36, p < 0.001, n one-way ANOVA, F(4, 39) = 6.74, p < 0.001. Bars and error bars indicate mean ± s.e.m. Tukey’s post-hoc tests were performed for pairwise comparisons; selected comparisons are highlighted ***p < 0.001, **p < 0.01, *p < 0.05, ns = nonsignificant p > 0.05

