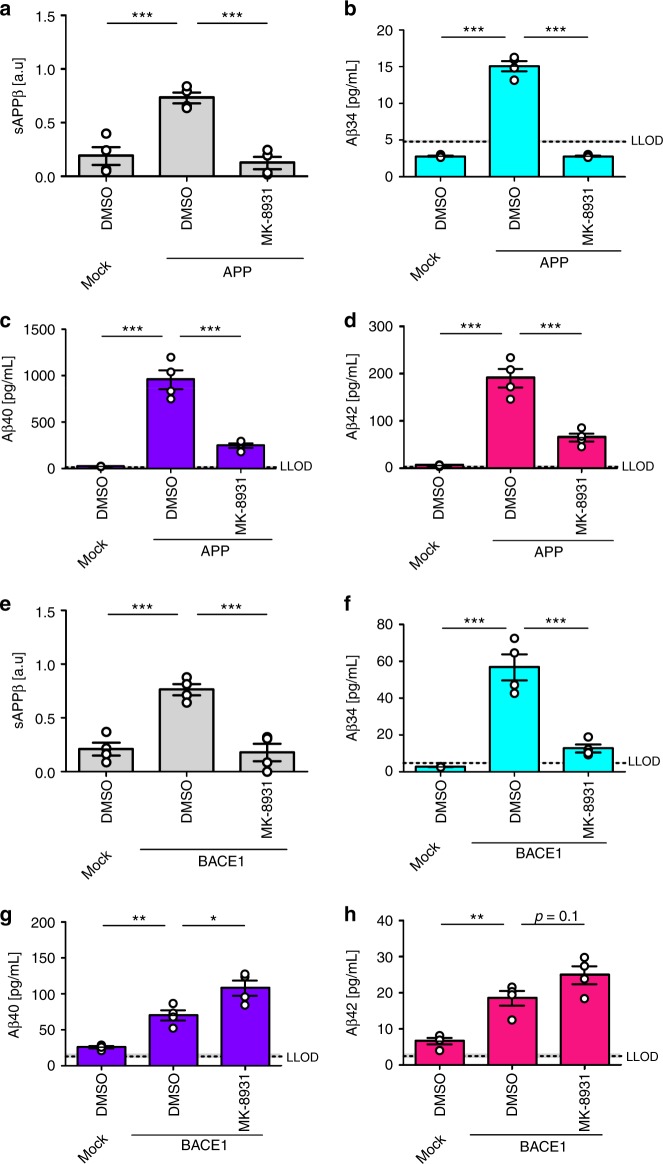
Fig. 4.
Surplus of APP or BACE1 affect BACE1 inhibition. Cleavage of APP was analyzed by western blot and ultra-sensitive MSD assays. Absolute or relative amounts of products were quantified from SH-SY5Y cells stably expressing APP695 (a–d) or BACE1 (e–h). Quantification of relative amounts of sAPPβ (a, e), and absolute amounts of Aβ34 (b, f), Aβ40 (c, g), and Aβ42 (d, h). Data were collected from four independent experiments. Bars and error bars indicate mean ± s.e.m. Tukey’s post-hoc tests were performed for pairwise comparisons; selected comparisons are highlighted ***p < 0.001, **p < 0.01, *p < 0.05. a sAPPβ, one-way ANOVA, F(2, 9) = 26.6, p < 0.001, b Aβ34, one-way ANOVA, F(2, 9) = 296.1, p < 0.0001, c Aβ40, one-way ANOVA, F(2, 9) = 65.9, p < 0.0001, d Aβ42, one-way ANOVA, F(2,9) = 59.4, p < 0.0001, e sAPPβ, one-way ANOVA, F(2, 9) = 25.4, p < 0.001, f Aβ34, one-way ANOVA, F(2,9) = 45.3, p < 0.0001, g Aβ40, one-wayANOVA, F(2, 9) = 30.8, p < 0.0001, h Aβ42, one-way ANOVA, F(2, 9) = 23.3, p < 0.001

