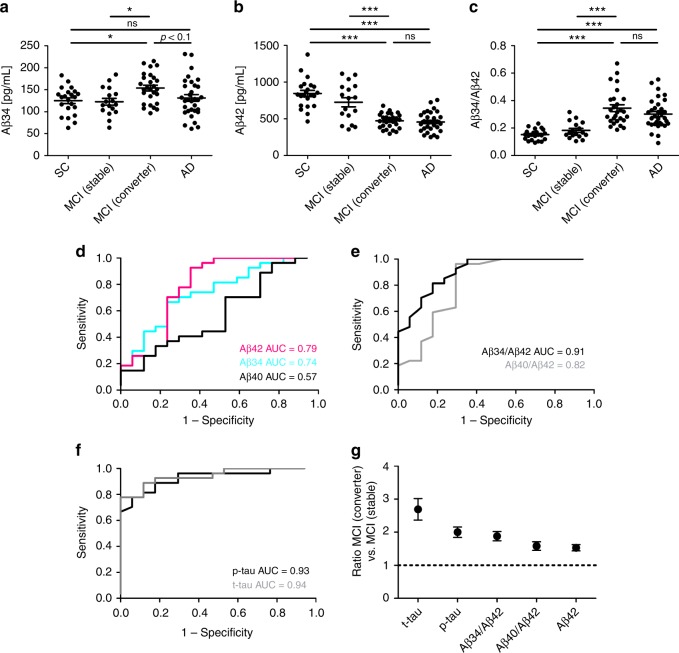
Fig. 6.
Aβ34 and core biomarkers in the Amsterdam Dementia Cohort. a–c Analyses of Aβ34 and Aβ42 in human CSF samples. n = 22 subjective complaints (SC), n = 17 MCI (stable), n = 27 MCI (converter), n = 32 Alzheimer’s disease (AD). Horizontal lines indicate mean ± s.e.m. The data were analyzed with one-way ANOVAs and Tukey’s post-hoc tests (***p < 0.001, *p < 0.05, ns p > 0.05). a Aβ34, one-way ANOVA F(3, 94) = 3.71, p < 0.05, b Aβ42, one-way ANOVA F(3, 94) = 30.91, p < 0.0001, c Aβ 34/Aβ42, one-way ANOVA F(3, 94) = 21.71, p < 0.0001. d Receiver operating characteristic (ROC) curves were computed on CSF levels of Aβ34, Aβ40, and Aβ42 in samples from the Amsterdam Dementia Cohort n = 17 MCI (stable), n = 27 MCI (converter). e ROC curves on Aβ40/Aβ42 and Aβ34/Aβ42 ratios from MCI (stable) and MCI (converter)). ROCs were compared using DeLong test: Aβ40/Aβ42 vs. Aβ34/Aβ42 (p = 0.0298). f ROC curves on p-tau and t-tau from MCI (stable) and MCI (converter)). g Comparison of the performance of various molecules measured in CSF, which is based on average MCI (converter) to MCI (stable) ratios in the Amsterdam Dementia Cohort. The MCI (converter) to MCI (stable) ratio of Aβ42 was inverted for better comparison with the other ratios

