Fig. 7.
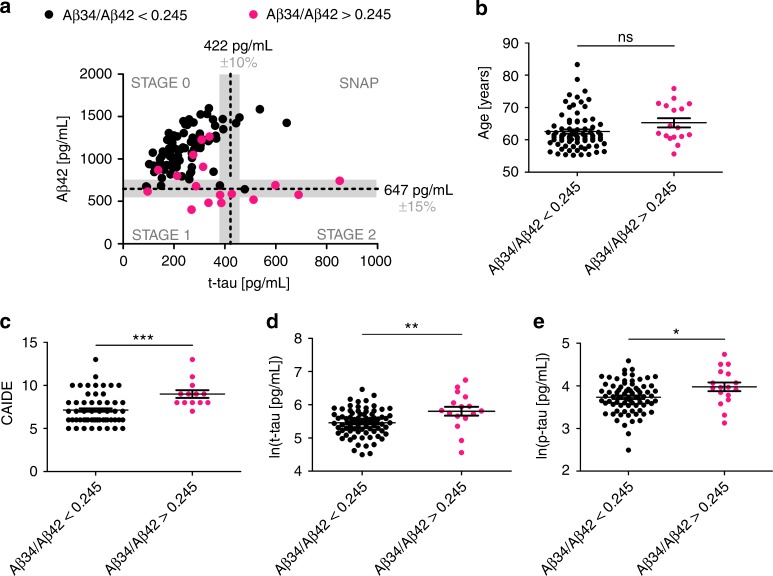
Aβ34, Aβ42, t-tau, and p-tau in PREVENT-AD. a–e PREVENT-AD Study: analysis of Aβ34, Aβ42, t-tau, and p-tau in CSF samples from cognitively normal individuals at risk for Alzheimer’s disease (n = 94). a Individuals can be separated into stages of pre-symptomatic AD, based on CSF biomarker assessment (t-tau cut-off > 422 pg/mL49,50, Aβ42 cut-off ≤ 647 pg/mL41, the gray shaded area indicates common inter-assay variances of the used cut-off values41,51). STAGE 0: t-tau and Aβ42 normal; STAGE1: t-tau normal and Aβ42 ≤ 647 pg/mL; STAGE 2: t-tau > 422 pg/mL, and Aβ42 ≤ 647 pg/mL; Suspected-non-AD pathology (SNAP): t-tau > 422 pg/mL and Aβ42 normal. Individuals with Aβ34/Aβ42 ratio above the optimal cut-off calculated in this study (Aβ34/Aβ42 > 0.245) are highlighted in magenta. b–e Comparison of age, Mann–Whitney U = 461.5, p = 0.0586 (b); Cardiovascular Risk Factors, Aging, and Incidence of Dementia (CAIDE), Mann–Whitney U = 184.5, p = 0.0004 (c); t-tau, unpaired t-test t(92) = 3.027, p = 0.0032 (d); and P181-tau (p-tau), unpaired t-test t(92) = 2.453, p = 0.0168 (e); between individuals with Aβ34/Aβ42 ratios above and below optimal cut-off (***p < 0.001, **p < 0.01, *p < 0.05, ns p > 0.05). Horizontal lines indicate mean ± s.e.m.

